As part of Phase II of the Zoning and Land Use Assessment and Recommendations project, MPC and the Urban Institute will be assessing and quantifying the extent to which zoning and changes in zoning throughout history have contributed to Chicago’s long-standing inequities across seven prioritized outcomes: affordable housing, business corridors, pollution exposure, transit hubs, productive land use, groceries & healthcare, and climate adaptations.
A necessary first step is to understand the city’s zoning map and citywide changes over time. As part of this, we used available data from three different points: 2003, 2012, and 2023 to show some of the major zoning trends in the last two decades.
Chicago’s Current Zoning Map and Major Changes Since 2003
Current data reveals that more than half of the city’s land area is zoned residential. 41 percent alone is dedicated to single-unit residential (RS). 13 percent is zoned as a Planned Development (PD), a zoning designation that provides for more public review of development proposals and allows for flexibility in selected use, bulk, and development standards through negotiations between the City and the landowner or developer. 11 percent is zoned Manufacturing, with an additional 6 percent zoned as a Planned Manufacturing District (PMD). A PMD is a zoning designation that is composed of industrial uses with regulations that prohibit residential development and other specific uses within them. The remaining zoning district classifications each comprise less than 10 percent of city land.
There have been significant and noticeable zoning changes since 2003. This is largely due to the rewrite of the city’s zoning ordinance in 2004 that brought forth a suite of zoning district conversions. New downtown zoning districts replaced chunks of residential, commercial, business, and manufacturing districts in and around the Loop. Parks and open space districts were established to preserve and enhance public open spaces throughout the city, and by 2012, had covered 7 percent of city land. Residential zoning districts were enhanced to further regulate minimum lot areas, height limits, and floor area ratios through the establishment of new RS, RT, and RM districts. Finally, a transportation zoning district was established with a classification of 48 acres of land.
Table 1. New Zoning District Classifications Established in the 2004 Zoning Ordinance 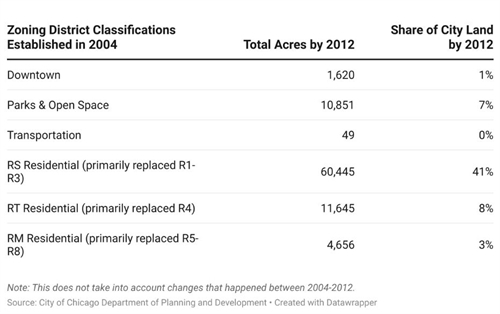
The share of city land zoned as each use has not changed much since 2012 aside from a few notable changes. In the last decade, the city added 1,472 new acres of PDs and 400 acres of parks and open spaces. More than 913 acres of manufacturing and 721 acres of PMDs were also rezoned to other uses. Table 2 provides a zoning breakdown that summarizes the changes in the share of city land zoned as each zoning district classification and the acreage changes in each of those classifications from 2012 to 2023. The table excludes 2003 as the zoning district classifications are too difficult to compare with all the changes that occurred.
Table 2. Current Zoning Breakdown in 2023 and Notable Changes Since 2012
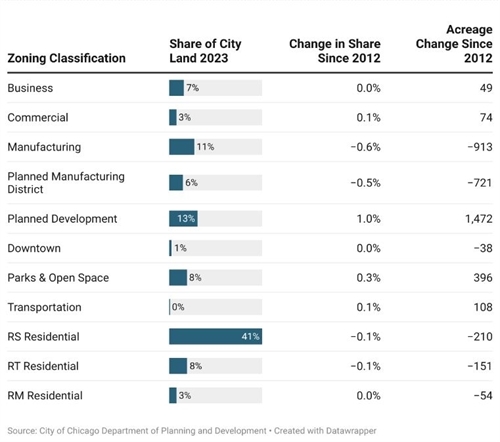
As Table 2 indicates, the most significant zoning changes since 2012 have occurred within the PD, PMD, and Manufacturing districts. Let’s dig into them more.
Planned Developments (PDs)
The last two decades saw increased use of PDs, netting 608 new ones between 2003 and 2023. There are 1,426 PDs throughout the city today compared to just 818 in 2003. However, the 75 percent increase in the number of PDs only translated to a 3 percent increase in the share of city land zoned PD. This suggests that the PDs added in the last two decades are much smaller in size than PDs that already existed in 2003. The increase in PDs since 2003 was not evenly distributed citywide with much bigger changes in certain neighborhoods. The Near West Side and Near North Side, for instance, each saw more than 300 acres (about the size of Grant Park) of new PDs in the last 20 years. The top eight community areas that experienced the biggest increases in PDs accounted for half of the citywide increase (see Table 3).
Table 3. Top Eight Community Areas with Largest Increases in Acres Zoned PD 2003-2023 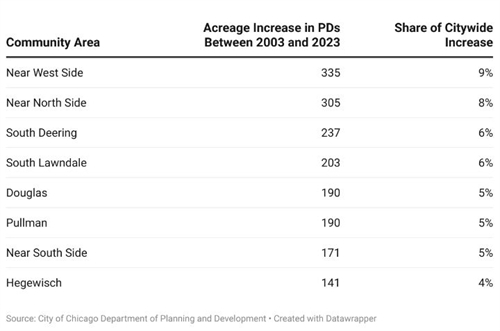
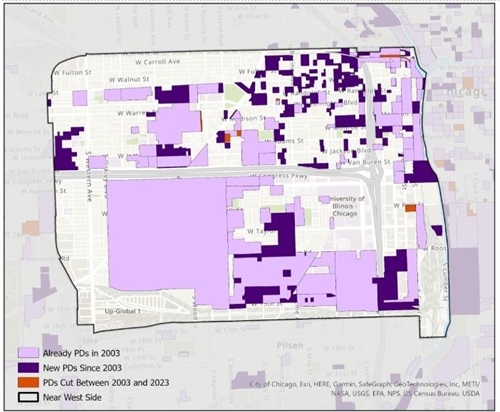
Figure 1. Planned Developments in the Near West Side, 2003 to 2023
Manufacturing and Planned Manufacturing Districts (PMDs)
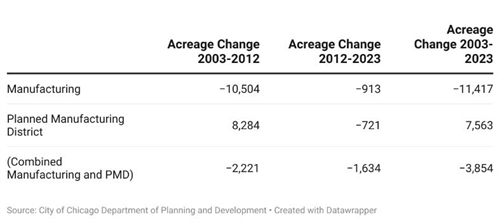
Unlike with PDs, trends around manufacturing districts and PMDs are less clear. There was a massive expansion of PMDs throughout the 2000s. As part of the City’s intent to foster the city’s industrial base, several industrial areas zoned as manufacturing were reclassified as PMDs. These reclassifications mostly occurred in the city’s south and west sides. It should be noted that the City rezoned more manufacturing districts in that decade than were reclassified as PMDs. As Table 4 shows, 10,504 acres of manufacturing districts were rezoned to other uses compared to the 8,284 acres that were reclassified as PMDs. In other words, there was a net loss of 2,220 acres of manufacturing between 2003 and 2012.
The City has since reduced the size of PMDs in the last decade. Between 2012 and 2023, 721 acres of PMDs were rezoned to other uses. There also continues to be a decrease in manufacturing. Between 2012 and 2023, 913 acres of manufacturing districts were rezoned to other uses. Taken as a whole, looking at the combined total acreage of manufacturing districts and PMDs, there are 3,854 fewer acres of land today zoned as either manufacturing or PMD than 20 years ago. This loss is the equivalent of 3 percent of the total city land – larger than the entire Near West Side community area and larger than 74 of the city’s 77 community areas.
Table 4 . Acreage Change in Manufacturing and PMDs Since 2003
Conclusion and Next Steps
Beginning in 2024, MPC and Urban Institute will assess and quantify the relationships and effects of zoning and zoning changes on the seven priority outcomes. This blog provides a baseline with some descriptive data to start exploring some of the changes that have occurred in the past twenty years. Neighborhood inequities are impacted by many factors, not only zoning and land use decisions. It’s important in conducting the analysis that we build in this understanding as part of the methodology, so that we can develop realistic recommendations for zoning and as well as other policies that influence development. This will require looking into the details of zoning, such as changes in bulk and density standards over time, changes in the maximum allowable heights in different parts of the city over time, etc. This will also require us to look at historical zoning changes. For instance, did downzoning throughout the north lakefront in the 1970s impact long-term affordability in those neighborhoods? Did industrial corridors designation in the 1990s have a quantifiable impact on residents' health outcomes in the south and west sides of the city? These are just a few of the questions we will delve into in the upcoming year.