
Steve Rhodes via Flickr
2013 Brighton Park Neighborhood Council march
To the extent that you’ve heard about Chicago’s population growth—or lack thereof—you probably know two things: Chicago lost population overall from 2000 to 2010, but the central area—Loop, West Loop, South Loop, Near North Side—is gaining people hand over fist.
Both true. But here’s another fact that hasn’t made the news: A cluster outside of the central area is also growing. Want to hazard a guess as to where it is? Lincoln Park? Logan Square? Lincoln Square? Hyde Park? Nope. All four lost population, from a 0.3 percent drop in Lincoln Park to a 14 percent decrease in Hyde Park.
BUT, if you head due southwest from the booming Loop, you will come upon a cluster of seven community areas that are quietly holding their own in population growth. In fact, while Archer Heights, Brighton Park, West Elsdon, Gage Park, West Lawn, Clearing and Ashburn combined average just 6.3 percent growth compared to the central area juggernaut’s combined 58.1 percent, the Southwest side cluster has actually contributed more residents to the city’s total: 8 percent versus the central cluster’s 6.9.
In a city that saw 60 out of 77 community areas lose population in the last Census, we need to understand what’s happening in the areas that are a draw.
A quick scan of Census data shows that each of the seven communities gained Latino population, by as much as 127 percent in Ashburn. All but one community, Gage Park, gained African American population. All but one, West Lawn, lost White residents.
All maps and graphs courtesy of Daniel Kay Hertz
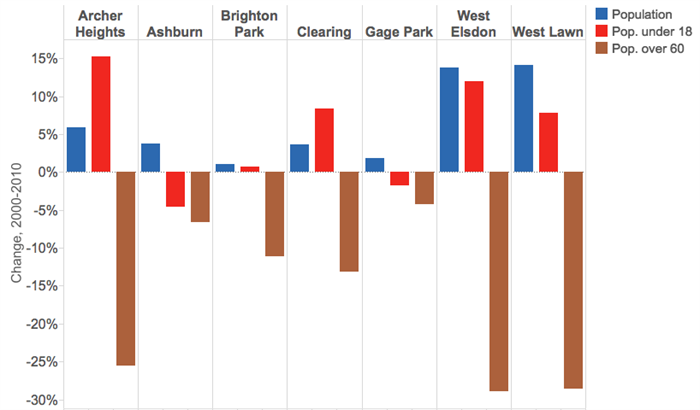
Change in age 2000-2010
At Tonti Elementary at 58th Street and Homan Avenue, Principal Gerardo Arriaga notes that in a school built for 900 students, they have nearly 1,100 attendees. They’ve already added a 12-room annex and a modular building, and are expanding pre-K from one classroom to four, though only in half-day segments due to high demand. They are on the Chicago Public Schools waiting list for another modular building, Mr. Arriaga told me from the small office he shares with a visiting principal. They’re packed to the gills.
He also notes that there’s not a lot of churn; while they have seen a steady increase in the student population over his six years at the helm, the school’s mobility rate is under 10 percent. Even when some families and teachers lost their homes to foreclosures during the recent recession, people stayed in the area.
While the school is 96 percent Latino, other immigrants also share the space. On the morning I visited, a new family from Lithuania was registering, while the week before, another family had left for their native China.
Farther north, the Brighton Park Neighborhood Council has had a unique perch to watch changes unfold. Longtime Executive Director Patrick Brosnan notes that the 1990s saw a major demographic shift from majority white ethnic to Mexican-American by the end of the decade, and it’s taken some time for institutions and service providers to catch up. In the housing realm, the recession and foreclosure crisis starting in 2008 accelerated a trend already underway: the doubling and even tripling up of families in living spaces. Indeed, the rise in population is especially notable given that the average number of new units across all seven neighborhoods was just 245. Because of this, while per capita income may be relatively low, household income is much higher.
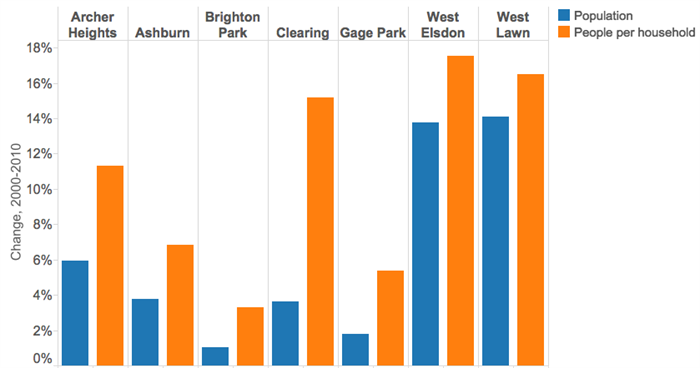
Change in people per household 2000-2010
As to where people are coming from, Brosnan’s sense is that early on, new residents to Brighton Park were shifting southwest from Pilsen and Little Village. As rents rose in Pilsen, people increasingly moved to areas like Brighton Park and bought an affordable home in the bungalow belt instead of renting.
Dan Loftus agrees with this assessment. His organization, PODER, has been providing English language and job training services in Pilsen since 1997. When they surveyed their students in 2008, they found that 25 percent were from outside Pilsen. By 2012, that figure rose to 48 percent. Today, 58 percent of students at the Pilsen site are not from Pilsen; many instead hail from further southwest. Recognizing that their base had shifted, Loftus advertised an English assessment on a recent Sunday on the Southwest Side. His staff prepared for around 30 people to show up, which had been their previous high. Instead, 134 people packed the assessment. Convinced of the need, Poder is now establishing satellite sites at 55th and Kedzie and 61st and Pulaski.
These maps using Census data show the dramatic shift in population that the Brighton Park Neighborhood Council and PODER have experienced:
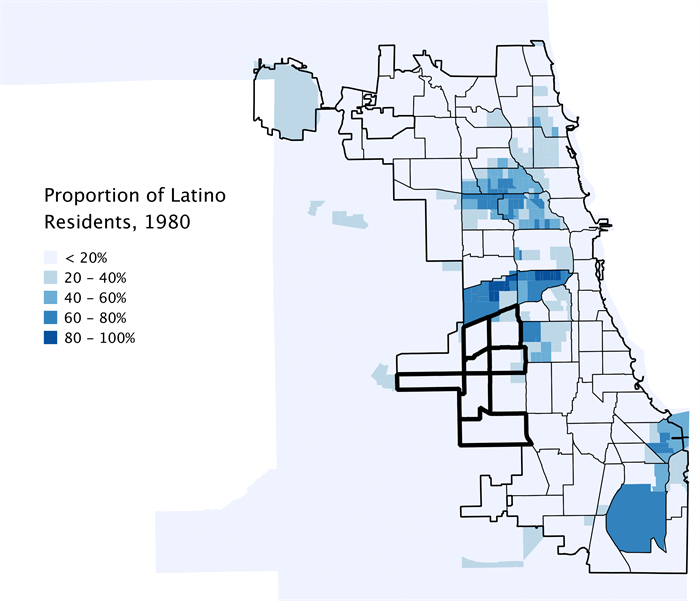
All graphs and maps courtesy of Daniel Kay Hertz
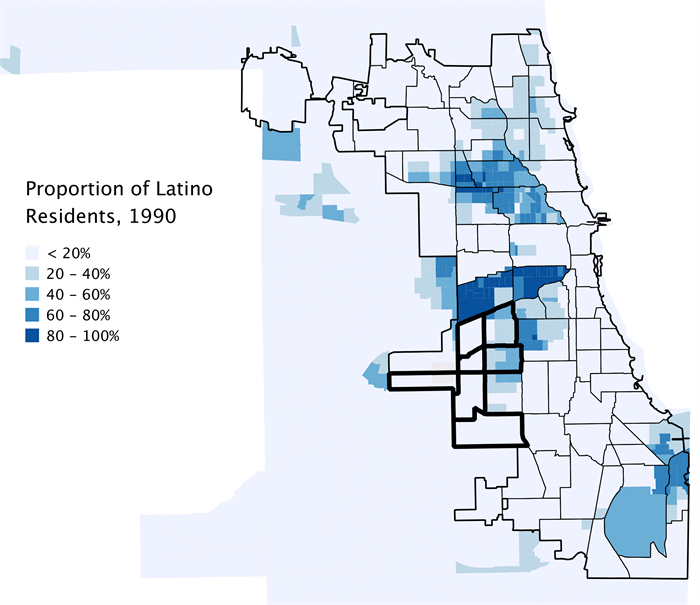
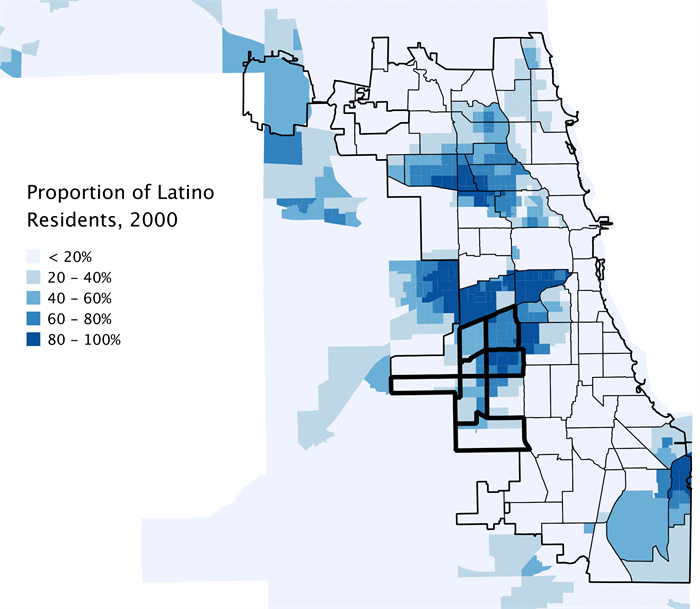
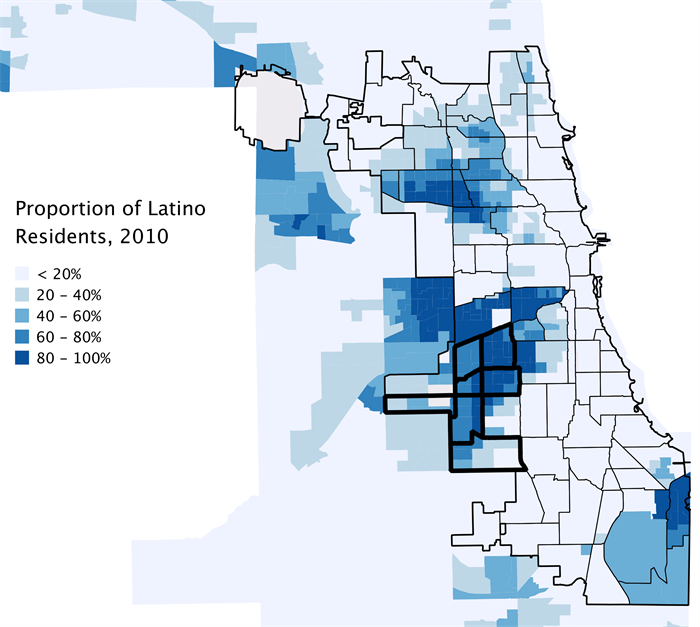
In addition to this inter-city movement, Brosnan notes that more recently, the area has also become a gateway community; that is, people immigrating from Mexico increasingly come directly to places like Brighton Park and bypass the more traditional neighborhood ports of entry further north and east.
In other demographics of note, all seven community areas experienced a uniform and significant decline in elderly population. Since most community areas in this cluster also had a concurrent rise in population under 18, many are experiencing a severe gap in access to childcare. Just as with Tonti, some elementary schools in Brighton Park are doing pre-K in shifts due to high demand. Brosnan worries about the lack of funds to invest in more quality childcare; after all, parents can’t work without childcare.
MPC has been talking about how we need to grow as a city. For the few parts of the city that are growing, how can we help? If the southwest side is becoming a port of entry, how can we make it easy for people to settle here? What social services are needed? What capital improvements, such as school additions, will help its new residents to thrive and become part of Chicago’s workforce? I’d like to see the City appoint a Growth Guru, someone who tracks demographics and works with forecasting data to zero in on which areas need which kinds of assistance in order to grow or to keep growing. The Chicago Community Trust’s Chicago Neighborhoods 2015 can provide an up-to-date baseline, and the nascent Chicago TREND can help identify and recruit retailers that are right for current and future demographics. To repeat: In a city that saw 60 out of 77 community areas lose population in the last Census, we need to understand what’s happening in the areas that are a draw. We can’t afford not to.