
Ken Teegardin
Do more overlapping units of government lead to bigger tax bills?
In seminal research on local government, University of Chicago Professor Christopher Berry found that a new unit of government was created approximately every 18 hours in the U.S. during the second half of the 20th century. Nowhere was this rapid proliferation more apparent than in Illinois. Since 1952, the number of local governments has more than tripled, primarily due to the rise of special purpose governments. Ironically, these new governments were created in response to legislation intended to keep the scale of government in check. In the Constitution of 1870, Illinois legislators limited the debt capacity of local governments. But with rising population and the pressing need for modern infrastructure, many officials evaded the borrowing restrictions on their municipality by creating new governments with power to tax and issue necessary debt.
The growth of these government units has fundamentally altered the organization of government and provision of constituent services. Instead of municipalities exclusively providing all local government services, these new districts overlap haphazardly with others and are responsible only for specific, narrow functions. As a result, the density of government—that is, the number of governments layered on top of one another in a given area—not only has grown dramatically, but also varies considerably from one area to another.
To further explore this proliferation and its possible effects, we examined government density in DuPage County, which contains nearly as many units of local government as the entire state of Nevada.
After mapping the jurisdictions of all local governments in the county, we identified how many units overlapped. The map below shows the range, with red indicating areas with the most units—15 layers of government—while dark blue indicates a relatively lower density, with only eight units of government. Five government units cover the entire county: DuPage Water Commission, Forest Preserve District, Airport Authority, DuPage County and Community College District 502. On top of these five, there are numerous and fragmented townships, township road districts, special police, mosquito abatement, park, fire protection, sanitary, school and library districts.
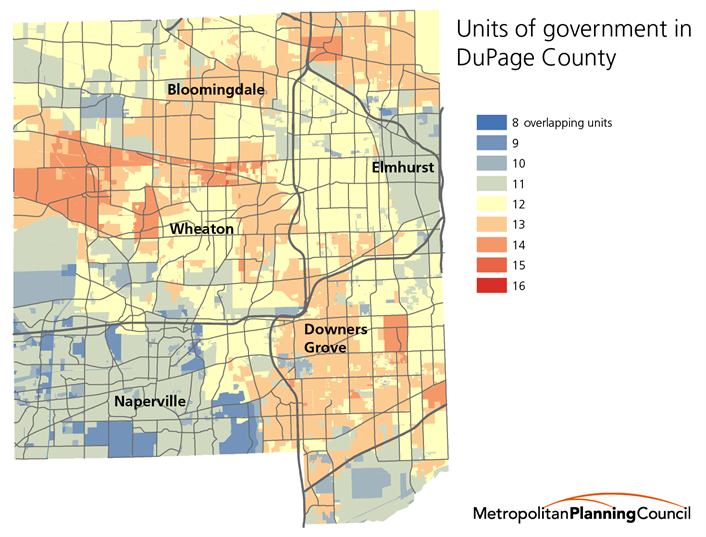
As the map shows, most areas in the county have some combination of 11 to 13 units of government. The least dense areas are found in unincorporated Naperville, with only eight units. In addition to the five countywide governments, a township, township road district and a combined grade school and high school district have jurisdiction in unincorporated Naperville. In contrast, a much longer list of government units comprise the densest parcel located in Carol Stream. Along with the five countywide governments, Carol Stream has a township, township road district, fire protection district, park district, sanitary district, mosquito abatement district, library district, high school district and grade school district.
Against this backdrop of considerable variation in government density, we explored the effect of increasing numbers of overlapping governments on residents’ tax burdens. In analyzing the more than 1,100 combinations of governments in DuPage County and their corresponding tax levies, we found a positive correlation between the number of governments and the tax burdens these units imposed. On average, the more local governments that appear on a resident’s tax bill, the higher their total tax burden.
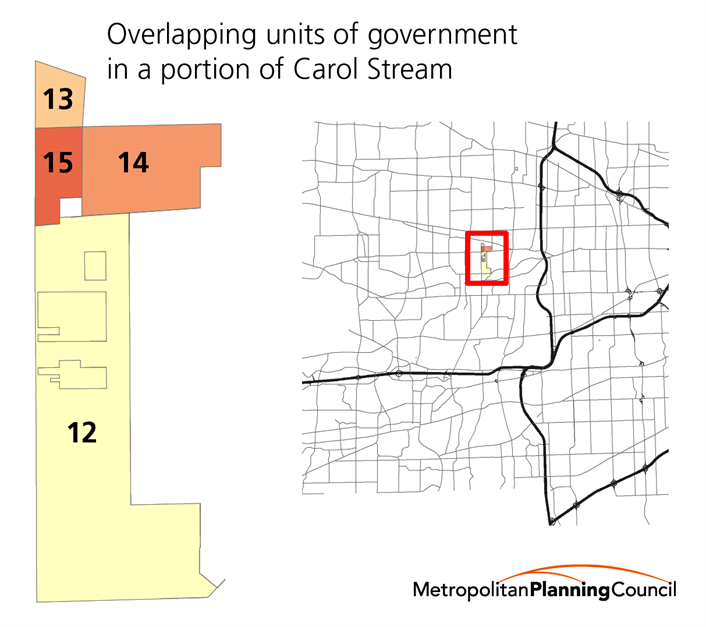
One area in Carol Stream, mapped below, is a particularly good example. For residents with the county’s median home value of $286,500, taxes are $831.81 higher if they live in the 15-unit area (the darkest area on the map above) than if they live just south in a 12-unit area. Consistent with the trend, taxes in the intermediary density, as shown in the chart below, fall in between those of the lowest and highest density areas.
DuPage is not the only place where higher tax burdens accompany areas with higher government density. Professor Berry, using thirty years of data from around the country, found a strong correlation between the number of overlapping jurisdictions and aggregate taxes.
What do residents in areas with more overlapping governments receive for their higher taxes? One might assume residents receive more or better quality services. But Berry found the same strong correlation between the number of overlapping jurisdictions and taxes even among areas that provided the same number of services.
Our findings also did not completely support that assumption. To compare services in high and low government density areas, we focused on nine core constituent services: water, sewer, parks, libraries, streets, fire protection, police, schools and mosquito abatement. We found that an area with higher government density did not necessarily have higher taxes because its governments provided more core services. On the contrary, in the Carol Stream example above, residents in the area of 15 units and the area of 12 units received all services from their respective governments despite the fact that the latter area had three fewer units.
When we looked more closely at services and costs in areas of different and similar densities, we continued to see a more complicated picture.
In Addison Township, areas with few units of government, unsurprisingly, did not provide all of the core services we were measuring. A resident in the area with nine units did not receive park or library access whereas residents in the areas with 11, 12 and 13 units did. If a family of four in the lower density area wants a library card, a summer pool membership at the nearest park district and or to send the kids to the park district’s summer camp, they would need to pay fees to the library district and higher non-resident rates for park programs. Even after factoring in these fees, residents with the DuPage County median home value still pay over $2,000 less if they live in the lowest government density area (dark blue on the map) compared to the highest density area (yellow).
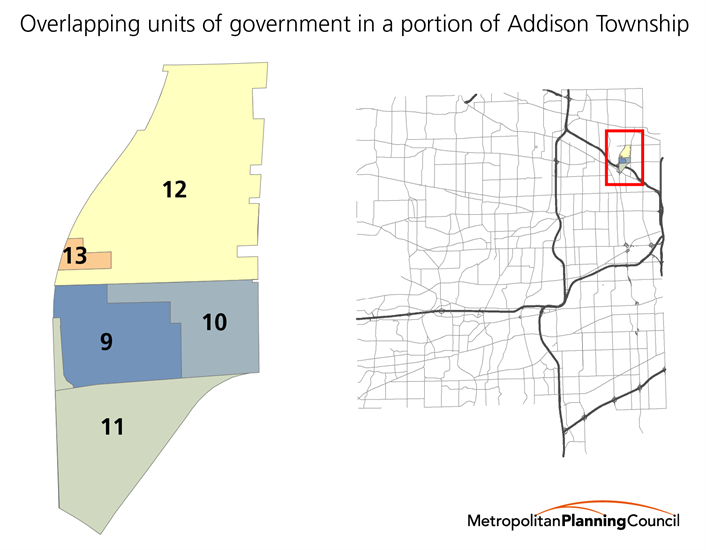
In this case, the difference in cost is not due to a difference in the number of services. Residents in the lower density area still come out ahead financially even after paying fees to obtain all services. Instead, the cost difference reflects the different districts that provide the same service. The area with nine units falls within Unit School District 205, which has a lower tax levy than the combined levies of the High School District 100 and Grade School District 2 which has jurisdiction in the area with thirteen units.
While the school districts in the denser area have higher tax levies, they do not have more or better schools. In just one metric of quality, the percentage of students who met or exceeded standards on last year’s Illinois Standards Achievement Test was around 30 points lower in the schools within the 13-unit area than schools in the area with nine units. (See District 2, District 100 or District 205 report cards.)
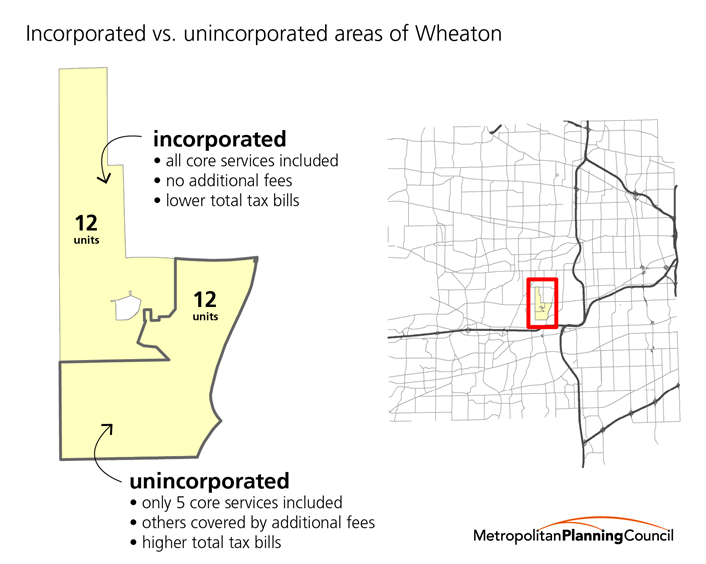
In addition to service variation in areas with different densities, we also found that even neighboring areas with the same densities offer very different levels of services. For example, in central DuPage, two neighboring areas both have 12 units of government. In the western area that is incorporated within the City of Wheaton, the 12 governments provided all core services. Yet, in the area just east, 12 governments provided only five core services. The discrepancy in service is due to the type of governments that comprise the areas’ 12 units. In the western area, a general-purpose municipality, the City of Wheaton, provides numerous core services such as water, sewer, police, fire protection and a public library. In contrast, the eastern unincorporated area relies on multiple special districts that provide single services—the Lisle Woodridge Fire Protection District and the Milton Township Special Police District. Even so, the 12 governments in the unincorporated area did not provide water, sewer, parks or libraries, requiring their residents to obtain water from private utility companies, pay fees to the library district and non-resident park district program rates. When it comes to cost, residents in the area with more special purpose districts face a lower tax bill, but they end up paying more for the same number services when these additional fees are added to their tax burden.
Our finding that greater government density correlates with higher taxes but not necessarily more or better services provides insights for local governments that, now more than ever, face increasing pressure to deploy tax dollars more efficiently. As Professor Berry postulates, this correlation may indicate an institutional tendency intrinsic to areas with many overlapping government units that share one tax base—one that is antithetical to government efficiency. Similarly to the problem of overfishing, Berry explains that each individual district or unit of government shares a common tax pool, but because of each unit’s autonomy and specialized function, it does not internalize the full impact of draining the tax base. If Professor Berry is correct, this is an inherent structural issue within local government that must be addressed.
But change should be sought not only for issues of government efficiency. High government density in DuPage also has implications for the democratic process. Unsurprisingly, residents in areas with higher densities must elect more officials to represent them. In the example areas previously discussed in this post, citizens must head to the polls four times every two years to elect between 88 and 121 officials for local government offices. Residents vote for DuPage County officials in even-numbered years along with state and federal candidates, but all other local officials are elected in odd-numbered years.
Gathering information about hundreds of candidates in order to become an informed voter is an enormous task and undoubtedly contributes to low voter turnout in local elections. On average over the past decade, only around 20 percent of eligible voters in DuPage cast a ballot in a consolidated local general election and less than 10 percent voted in consolidated local primaries. Low turnout skews election outcomes toward special interests as well as an older, whiter and more affluent electorate.
For ideals of civic engagement as well as government efficiency, this complicated patchwork of local government densities deserves consideration in discussions of local government reform going forward.