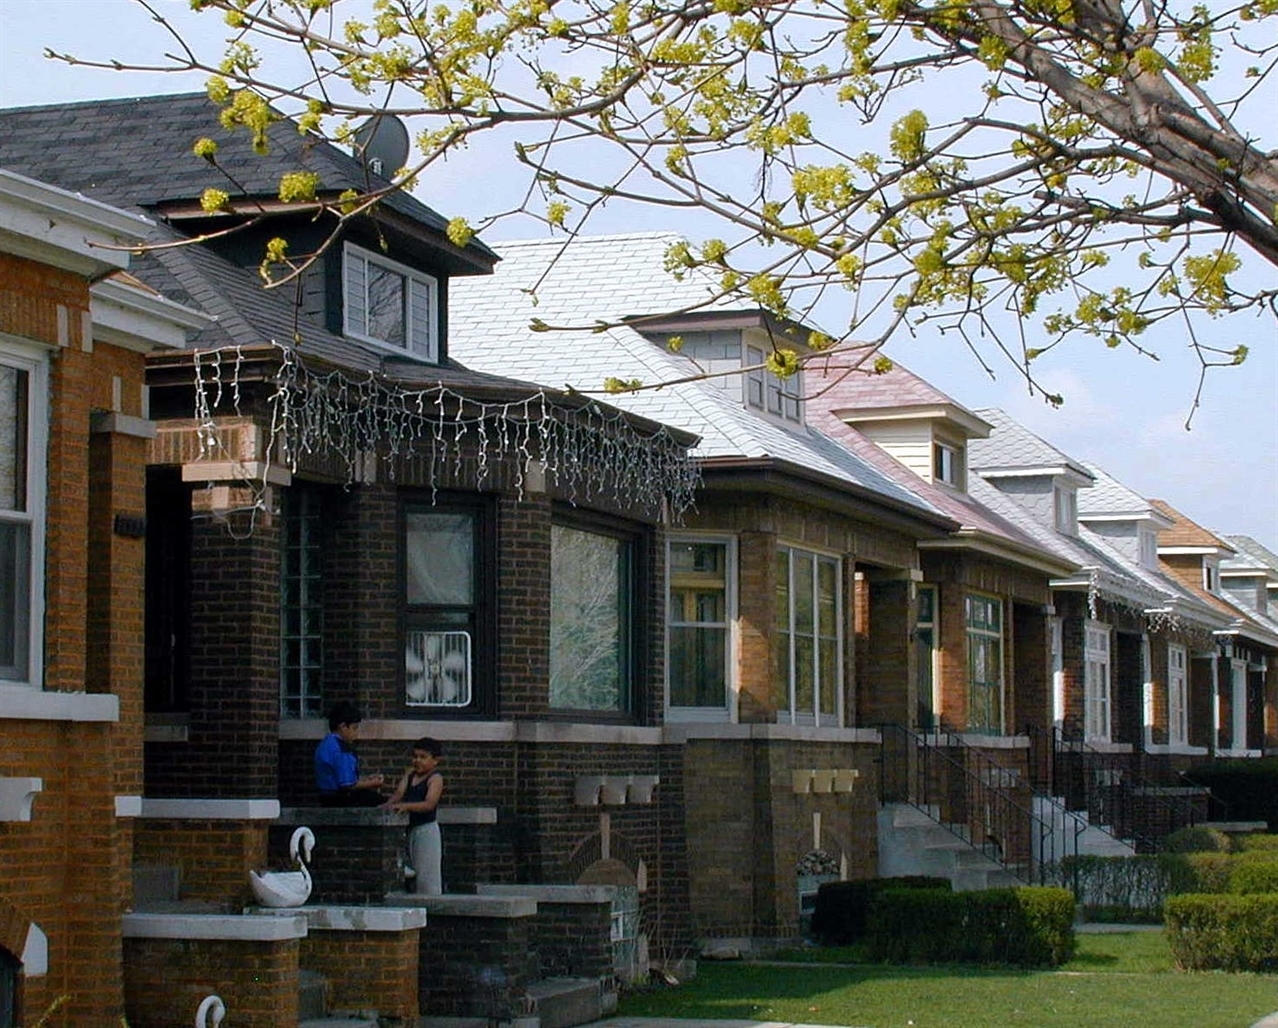
Flickr user Ed Boik (CC)
Chicago's bungalow belt in West Lawn
In this series, the Metropolitan Planning Council (MPC) will explore where Chicago’s middle class lives, along with mapping the middle class experience by race and how it’s changed over time for both the city and the region.
MPC and the Urban Institute are conducting a study on what income and racial segregation costs metro Chicago. In the course of talking about this work, many times people have challenged me that race is really not the issue, because after all, aren’t we really talking about income and class? Well, no. At least not completely. As Gary Orfield, co-director of the Civil Rights Project at the University of California-Los Angeles, says to Natalie Moore in her recent book on Chicago’s segregation, The South Side, “Class isn’t race and race isn’t class.”
Let’s take a line of research that came out in early May to dive into this. University of Southern California sociologist Ann Owens found that segregation between neighborhoods among families with children is high in the Chicago metro, about 8 percent higher than the average among the 100 largest metros in the U.S. Among households without children, however, from 1990 to 2010 segregation actually declined about 10 percent.
Her findings suggest that increased income segregation is caused more by choices by the wealthy than by low- or middle-class populations, and is largely due to the decisions of households with children.
Here is the part that seems race-neutral on the surface: Much of these findings have to do with Illinois’ school funding formula, which relies heavily upon local property taxes and results in vast disparities in per-pupil spending. The result is that when choosing where to live, parents are not just buying a house, they are buying a neighborhood, as Owens puts it. Parents who can afford to can buy their way into upscale neighborhoods with access to high-spending school districts. School quality is, as Emily Badger put it, “capitalized into housing prices,” rendering many neighborhoods unaffordable to the non-affluent. This helps explain why Owens found that by 2010, income segregation was two times higher among families with children under 18 than among households without them.
Here’s how this plays out within Chicago proper: If you want certainty in knowing your child can attend a high-performing elementary school, then you need to live within the boundary of a high-performing neighborhood school. At that point, while the school itself is free, the corresponding real estate is often at a very high price point. That’s your cost of admission.
But Chicago has school choice, you say. Doesn’t that make where you live matter less? Well, yes and no. The key word here is certainty, and certainty comes at a cost. There are many high-performing magnet and selective enrollment schools, but attendance is determined by a citywide lottery or scores on admissions tests, which makes acceptance up to chance or often intense preparation, and attendance up to the ability of families to manage long commutes. (Not to mention, as Northwestern sociologist Mary Pattillo documents in her research on school choice with high schools, the time and energy required to understand and navigate the magnet/selective enrollment process itself rules out many parents and guardians without the resources to do so.)
But consider this map of Chicago’s neighborhood-based elementary schools. The highest-ranked schools, level 1 and 1+, are marked in green. The lowest ranked, level 2 and 3, are in red.
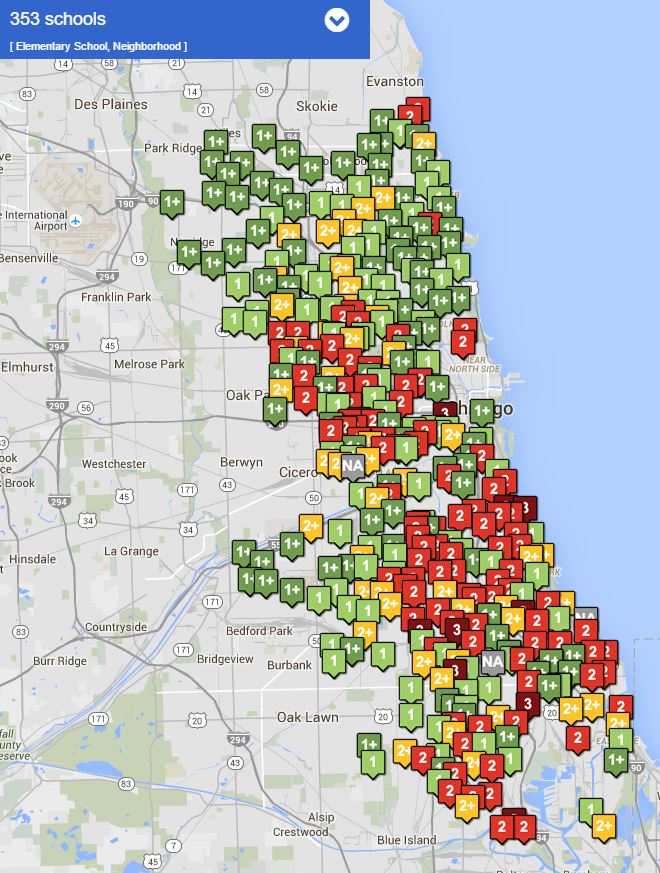
Chicago Public Schools
Lower-ranked neighborhood elementaries (in red) are clustered on the South and West sides.
Acknowledging that these rankings have plenty of critics and are just one way of many to determine the best fit for one’s child, the pattern is striking nonetheless. There are highly ranked neighborhood schools in most parts of the city, but the vast majority and the most consistent presence are on the North Side. Those familiar with Chicago will know that these rankings follow racial patterns closely, as we will see in this series.
So part of this story is definitely income and who can afford to buy certainty. But we really can’t talk about income segregation without talking about race and where people of different races live by income. Keep reading for more on how Chicago’s middle class census tracts break down by race, and how that’s changed over time.
To map this data, we selected the census tracts in Chicago which had median household incomes within the range detailed below and displayed the racial makeup of the total population within those tracts. Note that this does not represent the racial makeup of the middle class population overall, rather the total population that lives in census tracts with middle class median incomes.
Read on to learn more about our findings:
A note on defining our terms for the maps that follow: For middle class we used the measure employed by Pew Research Center in their recent study, which defines the middle class as two-thirds to two times the median income. With a median household income of $48,734, the City of Chicago’s middle class range is $32,489 to $97,468. Because of how Census data is grouped, we’ve rounded that to $30,000 to $100,000.
For a household of one, middle class income level ranges from $21,672 to $65,674 per year, while the middle class income level of a four person household can range from $58,029 to $175,844.
Yes, $30,000 seems low to be considered middle class. We had to use an objective measure, and this one dates back to Mollie Orshansky’s late 1960s work to determine the first official national poverty rate. Measuring the middle class is tricky, not least because of self-perception; according to a 2008 Pew Research Center (2014) survey, 53 percent of Americans identified themselves as “middle class.”
The authors speculate that this over-identification “likely lies with the powerful attraction that the label ’middle class’ has on most Americans and the stigma that some might associate either with the upper or lower class labels.” For a thorough review of definitions and measurements of the middle class, see this 2015 working paper from the American Institute for Economic Research.
MPC VISTA Fellow Elizabeth O'Brien contributed to this post.