New CMAP analysis studies the sidewalk network and its gaps across 284 municipalities
Chicago Metropolitan Agency for Planning
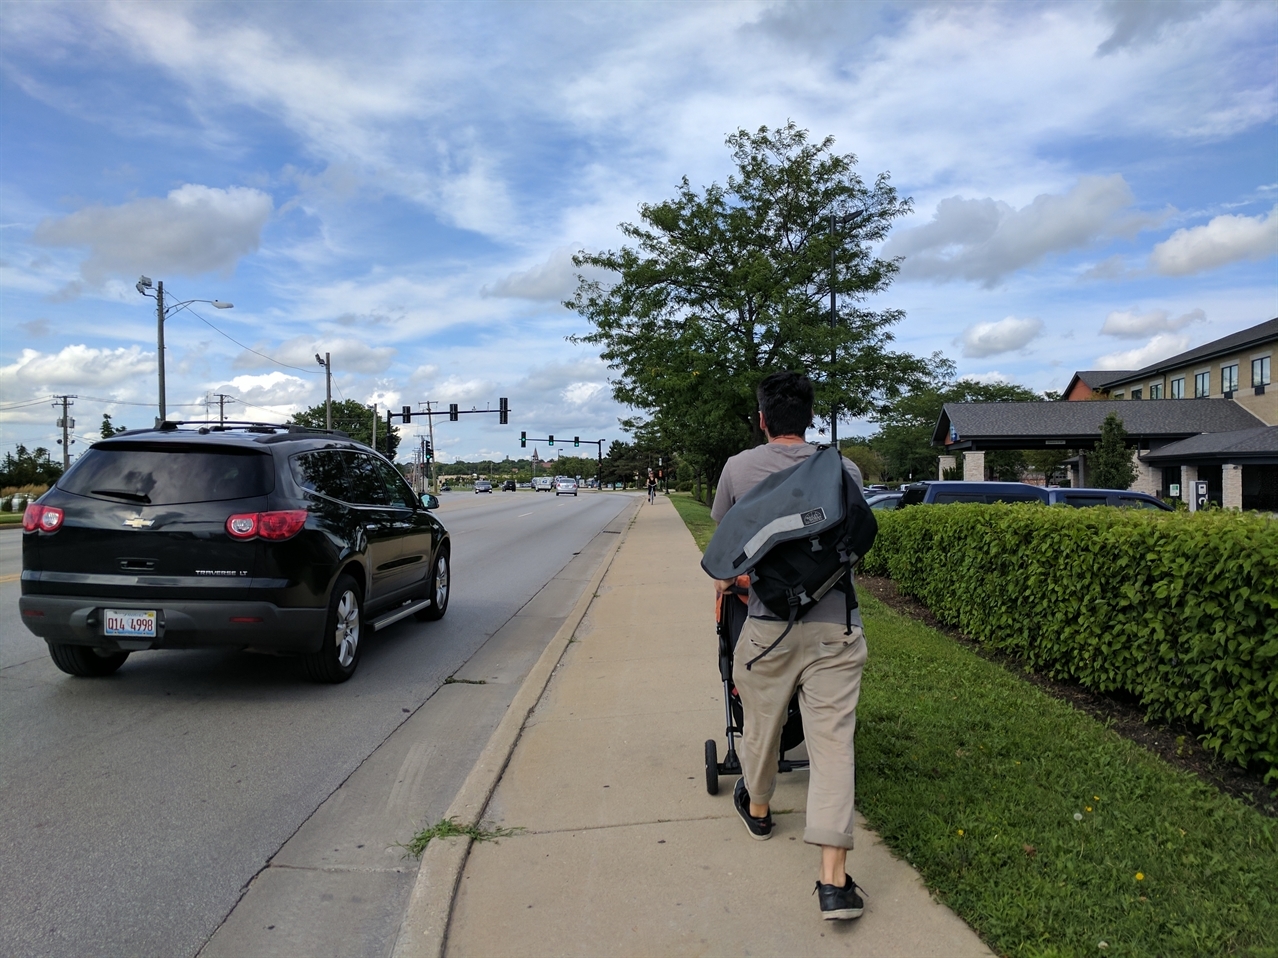
This sidewalk does not offer a barrier between the sidewalk and moving traffic, creating an unpleasant pedestrian environment.
 By Lindsay Bayley, Senior Planner, Chicago Metropolitan Agency for Planning
 - August 6, 2019
Consumer preference surveys and recent home buying trends indicate a growing desire for mixed-use communities with walkable amenities in both urban and suburban areas. Walkability and density are also important to support efficient transit services, like the more than 2 million rides per day taken on Metra, CTA, and Pace.
The Chicago region’s new comprehensive plan, ON TO 2050, includes a recommendation to support the development of compact, walkable communities.
But what is walkability? It’s a measure that usually takes into account issues like zoning, transit service, nearby destinations, and more. When the Chicago Metropolitan Agency for Planning (CMAP) analyzes walkability, it looks for answers to several “Walkable City” questions: Is the walk useful? Is the walk safe and does it feel safe? Is the walk comfortable? Is the walk interesting?
When CMAP was developing ON TO 2050, a critical component of the walkability analysis was missing—there was no regional data on sidewalks.
This year, using the publicly available Illinois Roadway Information System highway data and Nearmap aerial imagery, CMAP staff coded approximately 30,000 miles of roads in Cook, DuPage, Will, Lake, Kane, and McHenry Counties for the existence of sidewalks on one or both sides of the street and whether there is a barrier between traffic and the sidewalk. The new dataset shows that the availability, quality, and safety of sidewalks around the region varies greatly. The final product, a database now publicly available on the CMAP Data Hub, is a tool that leaders can use understand their community’s needs and prioritize sidewalk improvements in the future. It will be used to track progress toward developing more walkable communities.
Diving into the data
Older communities, especially those that developed before most people drove cars, have more complete sidewalk networks. A dense grid of streets with sidewalks and parkways, often connecting to rail transit, is more common in those older communities. There are some places where parkways and wide sidewalks were lost as roads were widened.
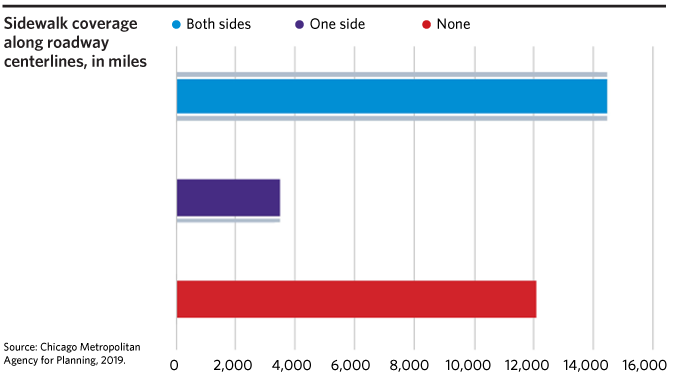
According to CMAP’s analysis, the community with the highest sidewalk-to-road ratio is the City of Berwyn, where nearly all streets have sidewalks on both sides. Across the region, more than 12,000 miles of roadways have no sidewalks; 3,400 have sidewalks on one side; and 14,400 miles of roadways have sidewalks on both sides. This analysis does not include limited access highways and associated on-ramps. Within municipal boundaries, the number of roadways without sidewalks shrinks to just over 7,000 miles.
Walking on a sidewalk along a busy road next to cars, trucks, and buses traveling in excess of 40 miles per hour is not a pleasant experience. One approach to improve safety and the perception of safety is to create a physical barrier between moving vehicles and the sidewalk. This barrier may be as simple as a grassy median; it may be a row of parked cars.
CMAP analysis indicates whether or not the sidewalks have any sort of barrier or protection from moving traffic. The vast majority -- 96 percent -- of sidewalks in the region have some form of protection.
Five ways your community can use the data
With a new trove of data available, there are several ways researchers, community planners, or others can use the CMAP Sidewalk Inventory including:
-
Identify transit stops without sidewalks nearby
: Improving access to transit is an important strategy in ON TO 2050 to make transit more competitive. For people like Heather and Garland Armstrong, traveling around the region on public transit can require pushing a wheelchair in the street where there are no sidewalks to get to a bus stop or rail station. The new CMAP sidewalk inventory data can help communities identify those gaps and prioritize future improvements.
-
Align sidewalks with development patterns
: Some commmunities require the construction of a sidewalk for every new development while others prefer a more rural character and intentionally do not build sidewalks. With this data, communities can focus energy and resources where there is the most potential to improve walkability – to connect the most important gaps.
-
Analyze connectivity along with demographic data
: Using the CMAP Sidewalk Inventory, communities can analyze sidewalk connectivity around schools or look at census tracts with a high concentration of seniors, people with disabilities or populations with low vehicular access. Most importantly, this data can help communities make informed decisions and prioritize investments.
-
Help make your community more accessible for everyone
: Local communities are required by the Americans with Disabilities Act (ADA) and/or the Rehabilitation Act to develop an ADA Transition Plan. In 2010, just over 50 municipalities had up-to-date transition plans. One of the hurdles to developing a transition plan is creating the initial inventory of sidewalks. The CMAP Sidewalk Inventory can be used as a starting point for each community to develop its Transition Plan.
-
Help your community make decisions about safety:
The CMAP Sidewalk Inventory can allow communities to cross reference locations with high rates of pedestrian and bicycle fatalities in context with their sidewalk locations.
Add your own
With the data, we hope that others will come up with additional ideas for analysis. The recently passed transportation capital program includes $50 million annually for walking and biking projects in the state. The sidewalk inventory should be used to prioritize the most important segments that will improve walking conditions for the most people.
Share your analysis, or use, of the CMAP Sidewalk Inventory with CMAP on Twitter using #2050BigIdeas.