The City of Chicago recently released data on the performance of the Affordable Requirements Ordinance. Here's where we see movement on affordable housing development and where current policy is failing to produce new units.

Image courtesy Wikipedia Commons
This blog entry is part of a three-part-series analysis of the ARO Dashboard.
Over 120,000 Chicagoans are currently cost-burdened, in need of affordable housing because they spend more than 30% of their income on their rent or mortgage. At the same time, our city and region both remain deeply and stubbornly segregated by race and income.
Rectifying these challenges is no small task. To get to a place where all Chicagoans have stable and affordable housing, the city needs a comprehensive approach that equitably produces new affordable homes in all wards and neighborhoods, that preserves existing affordable housing stock, and that protects vulnerable tenants and homeowners from displacement.
The Affordable Requirements Ordinance (ARO)
One important tool in the city’s housing production approach is the Affordable Requirements Ordinance (ARO). The ARO promotes affordable housing alongside the growth of market rate developments, commonly known as Inclusionary Zoning (IZ).
Generally, the ARO requires that developers who receive city assistance through land, financing, or a zoning change set aside 10% of units as affordable. Under the ARO, developers have various options for meeting their affordability requirements—through building affordable units on-site, building units off-site, or contributing an in-lieu fee to support the city’s Affordable Housing Opportunity Fund.
New Data Dashboard Released
This past November, the Chicago Department of Housing published a new interactive dashboard making data on units produced through the ARO more transparent. The dashboard shows where units have been built since the enactment of the policy in 2003, as well as where funds generated through the ARO have been allocated.
Upon its release, MPC staff and research assistants dug into the data to assess the impacts and effectiveness of the ARO to date, focusing specifically on units that are either under construction or that have been completed. Here are some questions we asked and the answers we found.
How many affordable units have been developed?
Since 2007, 1,046 units are either under construction or have been completed. Of these, over 1,000 are or will be on-site units; 444 homes have already been completed.
What neighborhoods are seeing the most ARO unit development?
In general, neighborhoods with development activity saw the most ARO units produced. This relationship makes sense, as the ARO is a tool that leverages market rate development for affordable units.
More specifically, the Near West Side (which includes the West Loop) has the most units, with 160 under construction and 39 completed. The Near North Side comes in second with 118 units under construction and 42 units completed. West Town and Logan Square have also had significant ARO unit production.

Importantly, the recently approved developments of Lincoln Yards and The 78, both of which triggered ARO requirements, will substantially increase the number of ARO units produced. Together, these mega-developments are expected to generate 2,900 ARO units, which will make the Near South Side, West Town, and Lincoln Park have the highest numbers of ARO units in the city. The 78 itself will generate up to 2,000 affordable units through ARO compliance, which will be the largest single addition of units in the history of the program.
How many units have been built in the pilot zones?
Between 2017 and 2018, the city added 5 ARO Pilot Zones, each of which have slightly different ARO requirements. The pilot zones generally have higher affordability requirements, ranging from 15% to 20%, and either eliminated or diminished in-lieu payment options.
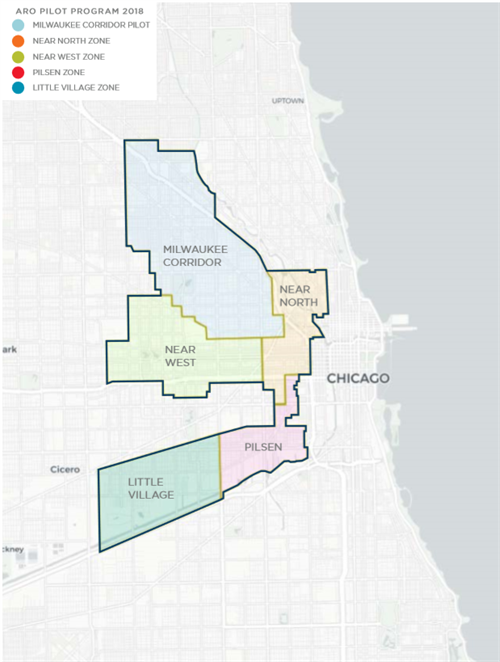
Image courtesy Cushman and Wakefield
While no ARO units have been completed to date in the pilot zones, a couple have some under construction. In the Near North pilot, 146 units are currently under construction with 12 of those units being off-site. By comparison, the Milwaukee Corridor pilot zone has 31 on-site units under construction. Neither the Near North nor the Milwaukee Corridor pilot zones have any units currently completed.
Among the other pilot zones, we found that no ARO units have been proposed, approved or built.

Image Courtesy City of Chicago
How did the 2015 ARO update change performance?
One of the changes between the 2007 and 2015 ARO is the ability for developments to fulfill the affordability requirement with off-site units within a certain mileage.
The dashboard shows a significant increase in ARO unit production since the 2015 ARO update. Since the update, 586 on-site units and 42 off-site units have either been completed or are currently under construction. Prior to the update, only 250 units had been completed.
The 2015 ARO update also created three zones in the city to reflect different housing markets: downtown, higher-income areas, and low-moderate income areas. Each zone has a slightly different ARO requirement. The higher-income zones have seen the greatest numbers of ARO units (262 homes) while the low-moderate income zones have seen the least (15 homes).

Summary
Given that the ARO is a tool that leverages private market development for production of affordable unit, it is not surprising that most units generated through the policy are in neighborhoods where development is currently happening (like the West Loop or Logan Square). The majority of ARO units are being built in higher-income neighborhoods and in downtown, which provides units for low-income Chicagoans in areas that they would otherwise not likely be able to afford.
The 2015 ARO update also led to greater production of affordable units. Changes in 2015 included creating a scaled system of in-lieu payment requirements and adding a requirement that 25% of required units be built (as opposed to paid in in-lieu fees). Less success has been seen in the pilot zones that were introduced in 2017 and 2018. The Near North and the Near West pilot zones are the only pilots with any affordable units under construction, and no ARO units have been completed in any pilot zones to date.
This is the first in a series of blog posts where MPC will dig into the ARO Dashboard. We will continue to share insights we find, ranging from where funds generated by the ARO have been allocated to how the 60% Area Median Income affordability levels of the program compare to incomes by race in Chicago.