When the City of Chicago released data on the performance of the Affordable Requirements Ordinance late last year, we compared average household paychecks and sizes against affordable units. The takeaway? There are gaps between what people need and the kind of housing that’s available.

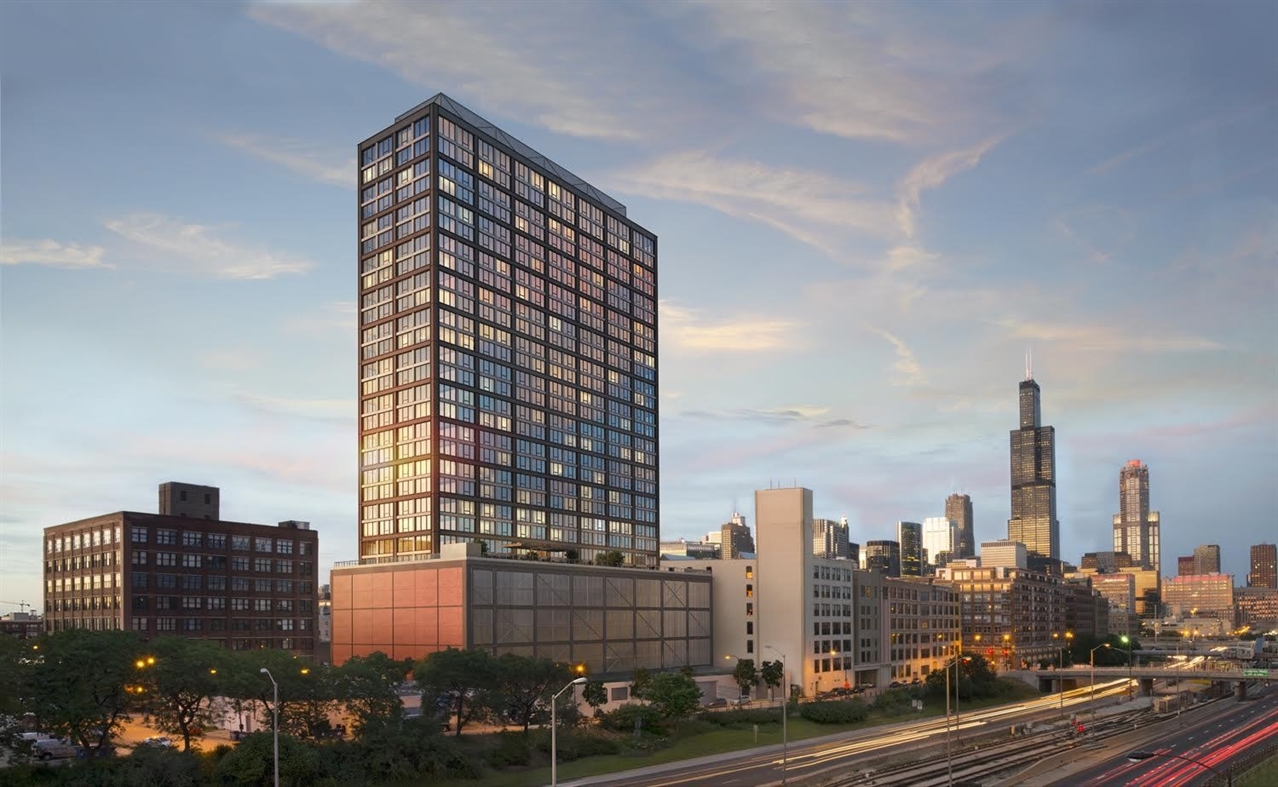
Image courtesy Chicago Property Shop, Landmark West Loop Apartments
The Landmark West Loop building is the type of property that triggers the Affordable Requirements Ordinance (ARO), which mandates either on-site or off-site affordable units or payment into the Affordable Housing Opportunity Fund.
This blog entry is part of a three-part-series analysis of the ARO Dashboard.
Over 120,000 Chicagoans are currently cost-burdened and in need of housing that is affordable. At the same time, our city and region both remain deeply and stubbornly segregated by race and income.
Rectifying these challenges is no small task. To get to a place where all Chicagoans have stable and affordable housing, the city needs a comprehensive approach that equitably produces new affordable homes in all wards and neighborhoods, that preserves existing affordable housing stock, and that protects vulnerable tenants and homeowners from displacement.
The Affordable Requirements Ordinance (ARO)
One important tool in the city’s housing production approach is the Affordable Requirements Ordinance (ARO). The ARO promotes affordable housing alongside the growth of market rate developments, and is a type of policy commonly known as Inclusionary Zoning (IZ).
Generally, the ARO requires that developers who receive city assistance through land, financing, or a zoning change set aside 10% of units as affordable. Under the ARO, developers also have various options for meeting their affordability requirements: through building affordable units on-site, building units off-site, or contributing an in-lieu fee to support the city’s Affordable Housing Opportunity Fund.
Last November, the Chicago Department of Housing published an interactive dashboard making data on units produced through the ARO more transparent. Since its release, MPC staff and research assistants have been digging into the data to assess the impacts and effectiveness of the ARO to date. This blog is the second in a series featuring some of the questions we asked and the answers we found. For this entry, we focus on one larger core question: who is currently benefitting from the ARO?
We looked to answer this question by comparing sizes and income limits of units produced by ARO with average household sizes and incomes of households of color. Given that the policy relies on federal income standards (which calculate affordability across the region) and leverages market development (which is primarily producing studios and 1-bedrooms), we found that many low income families of color cannot afford or fit into most ARO units.
What are the income requirements for affordable homes produced by the ARO?
To begin: the ARO currently defines affordability using the Area Median Income (AMI), which is based on incomes across the metropolitan region. This standard, based on federal calculation, is used to set the income requirements for affordable units produced by the ARO. In 2019, the U.S. Department of Housing and Urban Development (HUD) updated the AMI limits for the Chicago-Naperville-Joliet, IL Metro Area (see table below). As you can see below, the median income in the Chicago metro area for a household of 3 people is just over $80,000. This is significantly higher than the median household income in Chicago proper, which was $57,238 in 2018.[1]
|
Household Size
|
Area Median Income Limits - 2019
|
|
30%
|
50%
|
60%
|
80%
|
100%
|
|
1
|
$18,750
|
$31,200
|
$37,440
|
$49,950
|
$62,400
|
|
2
|
$21,400
|
$35,650
|
$42,780
|
$57,050
|
$71,300
|
|
3
|
$24,100
|
$40,100
|
$48,120
|
$64,200
|
$80,200
|
|
4
|
$26,750
|
$44,550
|
$53,460
|
$71,300
|
$89,100
|
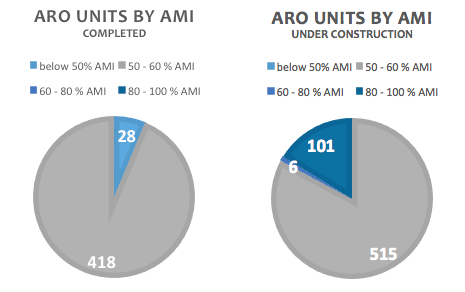
As we can see through the ARO Dashboard, the vast majority of ARO units completed or under construction are targeted for households between 50 - 60% AMI. This means that, for example, a 3-person household in Chicago must earn between $40,100 and $48,120 to qualify for almost any of these homes. In contrast, the average Black household income in Chicago is quite a bit lower at about $28,000.[1]

Are ARO units more accessible to individuals or families?
We also examined how the unit sizes of ARO units compared to Chicago’s demographics. According to the 2018 American Community Survey, the average household size in Chicago has almost 3 members. However, most ARO homes either completed or under construction are for smaller households. The most common ARO unit is a 1-bedroom, followed by studios and two bedrooms. Only 17 3-bedroom homes have been completed, with 32 currently under construction.
|
|
Studio
|
1 Bedroom
|
2 Bedroom
|
3 Bedroom
|
4 + Bedroom
|
|
Complete
|
105
|
228
|
96
|
17
|
0
|
|
Under Construction
|
161
|
275
|
148
|
32
|
0
|
This data indicates that the affordable units produced by the ARO are often better fits for individuals rather than families. Households with children will be disproportionately affected by the lack of affordable units with 2 or more bedrooms. Families of color are especially undeserved by these smaller units as they tend to have larger median household sizes. The average Latinx household in Cook County, for example, is almost 4, while the average White one is a little over 2. Asian and Black families also have larger average household sizes at almost 3 persons.
|
|
Latinx
|
Asian
|
Black
|
White, Non-Hispanic
|
|
Average Household Size
|
3.71
|
2.77
|
2.65
|
2.39
|
Who can afford an ARO home?
Given what we know about racial income disparities and household size differences in Chicago, we compared people’s needs with what’s available. We assessed the affordability and size of ARO units against racial demographics, finding that, on average, Black and Latinx Households will have a harder time than other racial groups affording ARO units set between 50-60% AMI (the most common affordability level of ARO units).[1]
Put another way, most ARO units are too expensive for the majority of black households in the city of Chicago. The average Black household in Cook County has almost 3 members. For a household of 3, 50% AMI in the region is $40,100. However, the average Black household income in the city of Chicago is still much lower at $27,713. Looking across all Black households in Chicago, about 63% earn less than $40,100. [1]
In contrast, the average ARO unit is similarly too expensive for only 27% of White households, which have an average household size of 2. This can be explained by that fact that White households have much higher incomes. Similar trends play out for Latinx households, with nearly 55% of households unable to afford the average ARO unit.
Summary
A deep dive into the ARO Dashboard shows us that most units currently produced by the ARO do not match the needs of low-income Chicago families of color. The majority of ARO units target households between the 50 – 60 % regional AMI limit. This means that the majority of low-income Black and Latinx communities are not able to afford the ARO units, with 63% of Black households earning below this limit.
In addition, the majority of units built are studios and one bedrooms. This contrasts with the median household size for Black, Latinx and Asian communities of 3 or 4 people per household. The current ARO units are most accessible to individuals or couples, leaving out larger families. These low income families are the ones who need the most assistance with housing.
All of this begs the question: if the goal of the Affordable Requirements Ordinance is to reduce racial segregation, how can it better reach the low-income households of color that it was originally set out to serve?
NOTE: We did not explore in this blog how well ARO units are meeting the needs of the disability community in Chicago. Further data on how many ARO homes are accessible for individuals with disabilities would also be needed to determine whether those Chicagoans are being served.
[1] According to data from the 2018 American Community Survey