Regional Rental Market Analysis Statistics - Metropolitan Planning Council

Skip to main content

Regional Rental Market Analysis Statistics

Graphs and charts from MPC's Regional Rental Market Analysis.

CHANGE IN RENT BY LOCATION , 1998 - 99

Overall Regional Rent Increase is 3.6%.
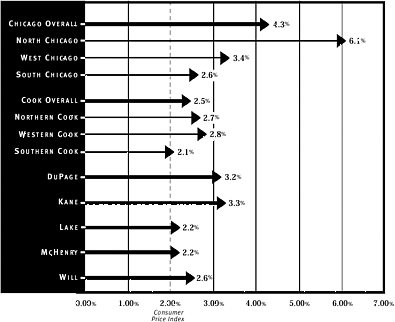
Source: UIC Rental Market Survey, 1999.
Cook refers to all of Cook County excluding Chicago.

ESTIMATES OF TOTAL AND OCCUPIED RENTAL UNITS BY LOCATION
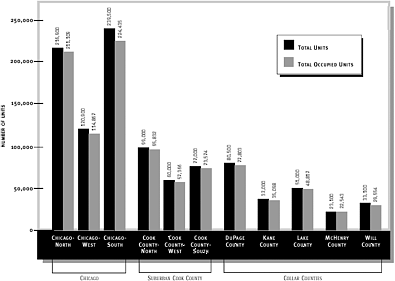
Source: UIC, 1999. Includes single family and multifamily private units.

COMPARISONS OF POPULATION AND RENTAL UNITS, 1999
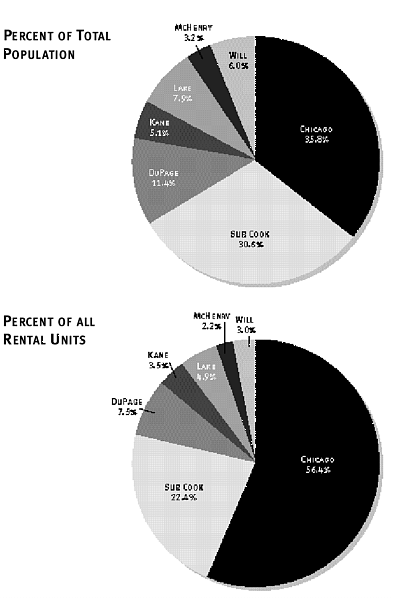
Source: UIC Rental Market Survey

PERCENTAGE OF INCOME DEVOTED TO RENTAL COSTS BY LOCATION
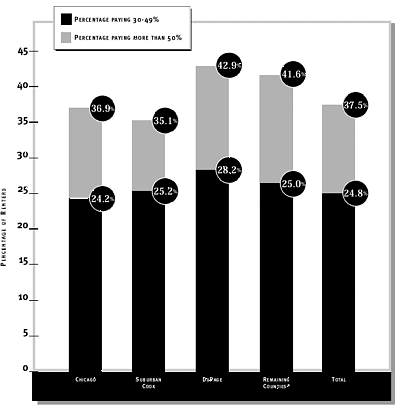
*Includes Kendall, Grundy, Kane, Lake, Will and McHenry Counties

Keywords

Housing

Comments

No comments

More posts by Samantha

All posts by Samantha »

MPC on Twitter

Follow us on Twitter »


Stay in the loop!

MPC's Regionalist newsletter keeps you up to date with our work and our upcoming events.?

Subscribe to Regionalist


Most popular news

Browse by date »

This page can be found online at http://archive.metroplanning.org/news/5504

Metropolitan Planning Council 140 S. Dearborn St.
Suite 1400
Chicago, Ill. 60603
312 922 5616 info@metroplanning.org

Sign up for newsletter and alerts »

Shaping a better, bolder, more equitable future for everyone

For more than 85 years, the Metropolitan Planning Council (MPC) has partnered with communities, businesses, and governments to unleash the greatness of the Chicago region. We believe that every neighborhood has promise, every community should be heard, and every person can thrive. To tackle the toughest urban planning and development challenges, we create collaborations that change perceptions, conversations—and the status quo. Read more about our work »

Donate »