
Flickr user John D (cc).
Biking in the snow is great, but not many people do it.
Published monthly, MPC’s Talking Transit, supported by Bombardier, provides updates about transit-related activities around the world. Read In the Loop for the latest transportation headlines.
Did you know?
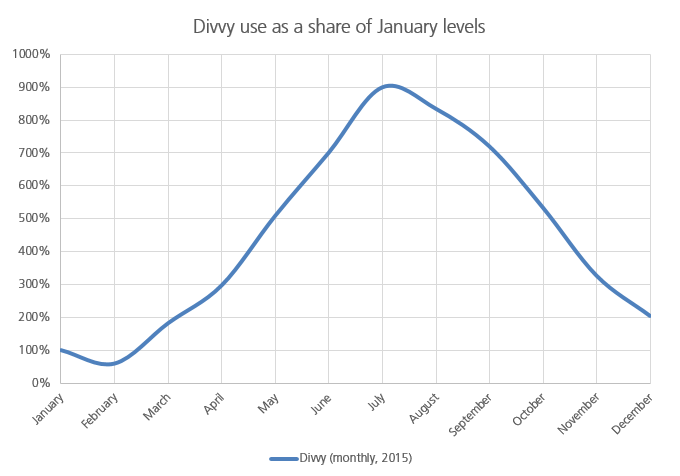
In 2015, roughly nine times as many people rode Chicago’s Divvy bike share system in July as in January. Perhaps that’s no surprise given our fair city’s wildly oscillating climate. But Divvy is hardly the only transportation service in the Chicago region that people use differently depending on time of year. In fact, use of all of our transportation systems changes month to month. Understanding when and how people get around is essential in planning transportation operations, as it affects how much service should be provided.
Different transportation options attract people differently throughout the year
Divvy, which by nature is an outdoor-only activity with no relief from the cold, has extremely varying use throughout the year. But our other transportation systems vary during the year as well.
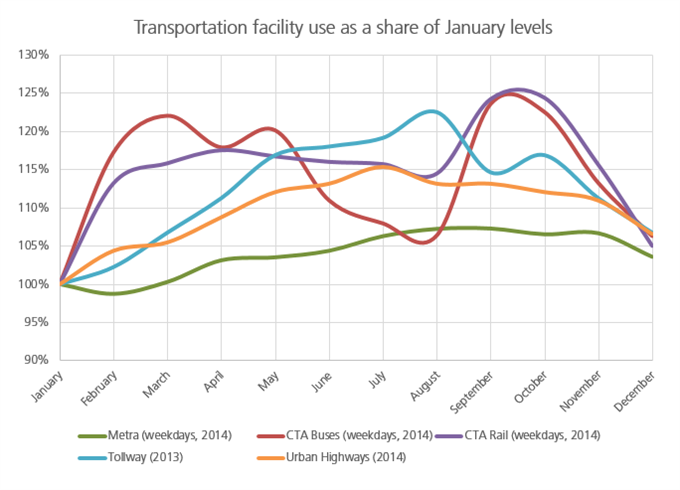
As the following chart demonstrates, the bus service provided by the Chicago Transit Authority (CTA) attracts very different passenger numbers depending on the time of year. On an average weekday in September 2014, for example, CTA buses served 25 percent more riders than on an average weekday in January. Similarly, the El was considerably more popular in the fall than it was in the winter.
Buses also see a considerable drop-off in ridership over the summer—a reflection of their importance to high school students, who use them to get around during the year (thanks to Daniel Hertz for this observation).
On the other hand, Metra commuter rail ridership was relatively constant during 2014, with less than 10 percent change over the course of the year. Perhaps those results are a reflection of the fact that many Metra riders get to their trains by driving to stations, whereas CTA riders mostly walk to theirs.
Finally, traffic on the Illinois Tollway and highways managed by the Ill. Dept. of Transportation increases substantially during summer months. This suggests that people take more discretionary trips during the summer—maybe a consequence of longer daylight hours, more tourism or simply a desire of more people to be out and about.
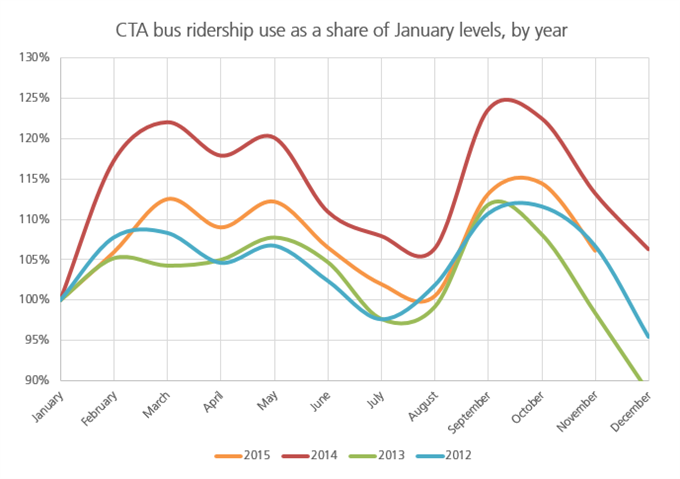
These changes vary depending on the year studied of course—specific events, such as the particularly harsh early months of 2014, may have altered the transportation environment dramatically.
Nevertheless, examining four years of CTA bus ridership, between 2012 and 2015, demonstrates that the trends remain the same. As shown in the following graph, ridership was highest each year in September and October, and lowest in the depths of winter and the heights of summer.
This suggests that seasonal variation in transportation use is not a fluke as much as a repeated trend that can be relied upon.
Other cities feature different travel patterns
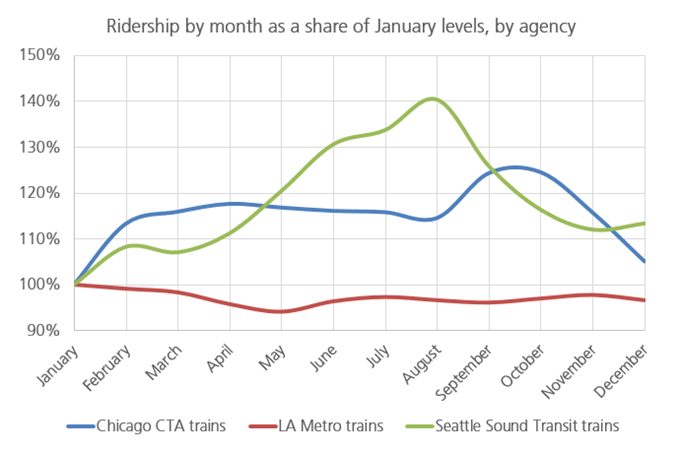
Chicago is not alone in seeing changing ridership on its transit system over the course of the year. As the following graph shows, Seattle’s Sound Transit light rail network (shown in green) has far more varied ridership than even CTA El lines, with about 40 percent more average weekday riders in August than in January.
On the other hand, Los Angeles’ rail system (shown in red) has a roughly steady ridership load throughout the year. Perhaps because of L.A.’s uniformly comfortable climate, passengers ride trains throughout the year at uniform rates. Even so, Seattle is hardly a cold-weather place, so perhaps other factors, such as increases in summer tourism, are at play.
The use of Chicago’s bike sharing system is even more variable than that of its transit network, but in that matter, too, it is not alone. University of Minnesota Professor David Levinson and his team found that bicycling behavior in the Twin Cities varied greatly depending on the season, more than doubling during summer months. This is despite the fact that Minneapolis and St. Paul have a reputation as places where people bike no matter the temperature outside.
In Madison, Wisc., the number of people biking increased dramatically as temperatures increased, according to a recent look at bike counts. But when precipitation fell, cycling counts declined considerably during the hotter months.
Implications for transportation planning
The fact that people use transportation systems in different ways throughout the year isn’t just a matter of curiosity. Indeed, it affects the way transportation services are provided and the way we budget for their operations.
For example, if considerably more people ride CTA buses and trains in the fall months, that might mean it is important to expand service to compensate for the increase in riders during that period. Similarly, if Divvy bike share is rarely used during the winter, that might mean less need for workers who redistribute bikes throughout the system during that time.
In addition, we need to take into account seasonal variation when discussing issues such as the mode of transportation people used by commuters. Last year, I wrote about changes in the ways Chicagoans are getting to work, showing that between 2006 and 2014, more and more of the city’s commuters walked, biked or took transit to work—rather than driving. Yet what is undoubtedly true is that the share of people biking during the summer is far higher than during the winter, for example. Taking that information into account is essential in understanding how transportation systems work.
What is also likely true is that peoples’ discretionary trips—in other words, those that are not related to commuting—change more dramatically than commute trips. Metra is the most heavily commute-oriented transportation system examined in this article, and its ridership is the steadiest throughout the seasons. This suggests that peoples’ non-commute trips are the most likely to change depending on the weather.
If we want our transportation systems to work as efficiently as possible, data like these are essential in helping us identify investments and appropriate services provided. Given limited resources for transportation and MPC’s work on using performance measures to identify appropriate investments, understanding travel patterns is all the more essential.
Data sources: