Flickr user Ian Freimuth (CC)
Chicago’s Kenwood neighborhood is 68 percent African American and 70 percent middle class.
In this series, the Metropolitan Planning Council (MPC) will explore where Chicago’s middle class lives, along with mapping the middle class experience by race and how it’s changed over time for both the city and the region.
In the second post in this series, we examined Chicago’s middle class census tracts and the fact that more than 60 percent of those neighborhoods’ occupants are people of color. From a sheer numbers standpoint, it would seem that Chicago can boast a fairly robust middle class experience for its black and brown occupants.

Benton Dosky
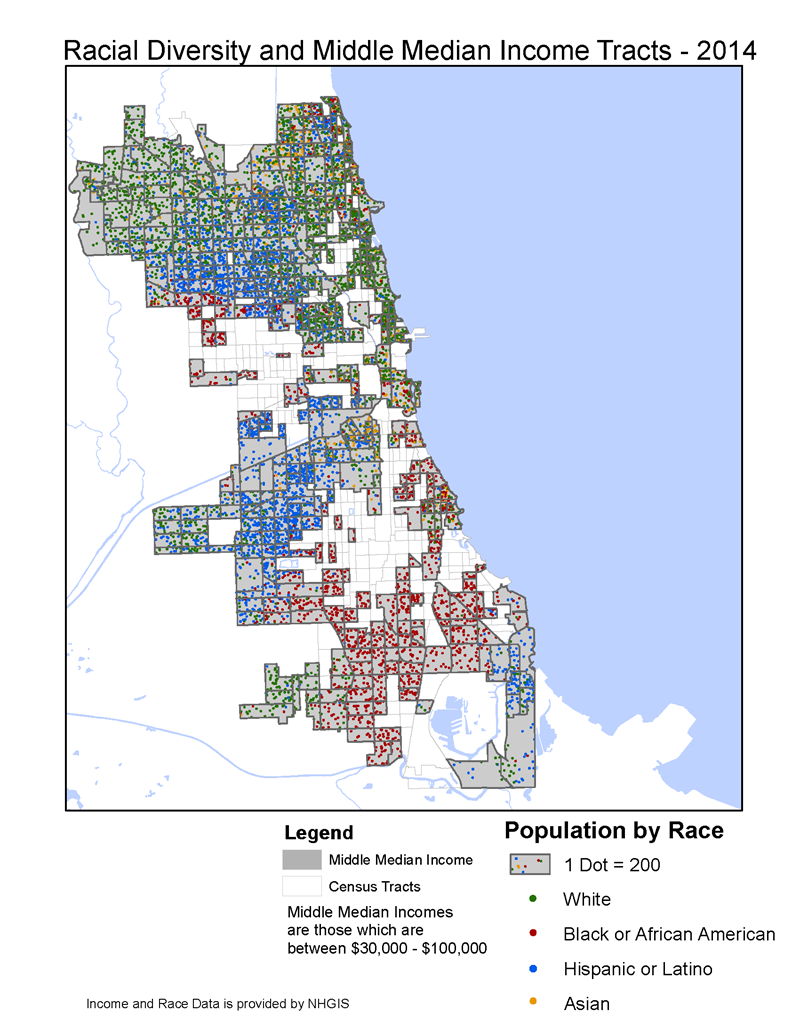
Digging deeper, though, we found in the map above that the African American and Latino experience in middle class census tracts is a much more segregated experience than whites in middle class tracts, which enjoy a higher level of diversity. To further understand the differences in middle class experiences by race, it helps to examine the non-middle class census tracts surrounding them.
Why? When artist Theaster Gates spoke at MPC a couple years ago, he talked about the importance of negative space, which in the arts community means the space around things. He pointed out that artists think about negative space almost as much as they think about positive space. I’d like to take that mindset here; note that in the map above, some census tracts are blank. That’s because their median income either falls above or below Chicago’s middle class income range. Determining what makes up those (negative space) census tracts tells us a lot about the experience of the (positive space) middle class.
Let’s start with census tracts with an upper income median, meaning the midpoint of all incomes in these tracts is above $100,000.

Benton Dosky
These upper-income census tracts are majority white (whites make up 76 percent of Chicago’s higher median income census tracts) and directly mirror the majority white, middle class areas from the first map. This means that whites in middle class areas are largely surrounded by people earning similar or higher incomes than them. African Americans and Latinos each make up 7 percent of high-income earners in upper-income tracts, and Asians are at 8 percent.
In contrast, consider the map of low-income census tracts, in which the midpoint of all incomes is below $30,000.

Benton Dosky
This map shows that, in contrast to areas with high levels of the white middle class, African Americans and, to a lesser extent, Latinos in middle class census tracts are largely surrounded by tracts with lower median incomes. African Americans make up 75 percent of the population in these lower median income tracts, compared to 16 percent for Latinos, 5 percent for whites and 3 percent for Asians.
What does this tell us about the experience of the black middle class in Chicago?
Last week, the Chicago Reporter examined the black middle class in Chicago’s Kenwood neighborhood, which is 68 percent African American and 70 percent middle class. Fifty-nine percent of the middle class population in this community is African American. The Reporter notes that middle class African Americans pay a price for living in neighborhoods like Kenwood, where their homes have less value than in comparably middle class white neighborhoods, and where rates of poverty and crime are substantially higher. The Reporter quotes Derek Hyra of the Metropolitan Policy Center at American University, who says that middle-class whites are more likely to reside in communities insulated from high concentrations of poverty, and that “the black middle-class is more vulnerable.”
In her recently released book, The South Side, WBEZ reporter Natalie Moore chronicles a similar tale from her own family. Moore grew up in black middle class Chatham, and while in college her parents moved to Beverly, a Southwest Side neighborhood that stands out for its integration in the maps above. Moore notes that it turned out to be a smart financial move, as home values in Chatham are stagnant at best while 60 percent white Beverly’s values are ascendant.
However, Emory University School of Law’s Dorothy Brown points out that even though property values improve with majority white homeowners, values are still lower in areas where the population is more than 10 percent African-American. Moore calls this the “integration penalty.”
Switching gears away from class for a moment, a recent New York Times/Kaiser Family Foundation poll asked Chicagoans of all incomes to rate their experience living in Chicago. The results were stark: While residents of all races shared concerns about the overall direction of the city, responses to many questions broke forcefully along racial lines. For instance, in response to the question "How would you rate your neighborhood as a place to raise children?," 44 percent of black respondents rated their neighborhood as a poor place to raise children, while just 16 percent of white Chicagoans did so. Forty-nine percent of black Chicagoans rated it “likely” that a young person in their neighborhood will be a victim of violent crime, compared to 19 percent for whites. The New York Times points out that the poll confirms that few issues define Chicago’s divide more than schools. Most Chicagoans say their neighborhood lacks quality public schools, but the misery is lopsided: On the South Side, 71 percent of African Americans say so.
Blacks and Latinos are more likely to say they want to get out of their neighborhoods and out of Chicago period.

Benton Dosky
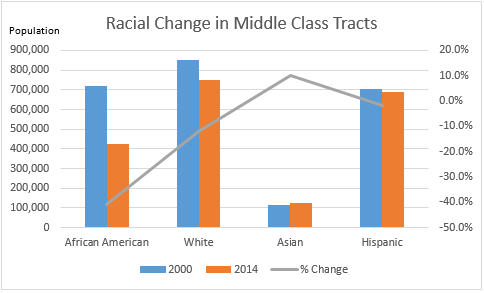
Change in population in Chicago's middle class census tracts, 2000-2014
As it turns out, they already are. Chicago is experiencing a major demographic transition. We lost 177,000 African Americans during the 2000s, and another 53,000 since 2010. The city’s African-American population in middle class census tracts fell 41 percent from 2000 to 2014, from more than 700,000 to less than 425,000. During this same time period, the white population in middle class areas dropped 12 percent, Latinos lost 1.8 percent and Asians grew by nearly 10 percent.
As we’ll examine more in an upcoming post in this series on regional demographics, African American population loss is not simply a matter of transition from city to suburbs—the region lost almost 23,000 African Americans overall.
Considering the poll above, it’s easy to see why: African Americans have a profoundly different experience of living in Chicago than whites do. Higher incomes can provide some measure of options, but it’s hard to escape what Natalie Moore calls the “black tax” that African Americans pay as a result of racial segregation. Class is heavily racialized in this city.
To learn more about Chicago's middle class, read the other posts in the series.
MPC Research Assistant Benton Dosky contributed to this post.