People of color in Illinois are up to twice as likely as White Illinoisans to live in the communities where almost all of Illinois' lead service lines are located
For several years MPC and numerous local, state, and national groups, have been beating the drum to advocate for eliminating lead service lines in Illinois. Service lines bring drinking water into our homes and other properties from a utility’s water main. As of 2018, Illinois reported more service lines made of lead than any other state—some 686,259, with many more “of an unknown material.” While this problem affects communities from downstate Cairo, Illinois, to upstate Waukegan, MPC wanted to know: Are Illinois’ residents of color more likely to be exposed to this toxic infrastructure? Do Black and Brown communities bear a disproportionate burden of lead in drinking water?
The answer appears to be affirmative: 65% of the state’s Black and Latinx residents, and 42% of Illinois’ Asian-American and Native American populations, are living in communities containing 94% of the state’s known lead service lines; meanwhile, only 30% of the state’s white population is living in those same communities.
Communities with the most lead service lines house 65% of Illinois’ Black and Latinx population, 30% of White population
To help us understand any potential patterns of racial bias, we zoomed in on the 50 municipalities in Illinois with the most lead service lines. Overall, these municipalities account for 94 percent of all known lead service lines in the state. So, who lives in these municipalities? The answer is telling.
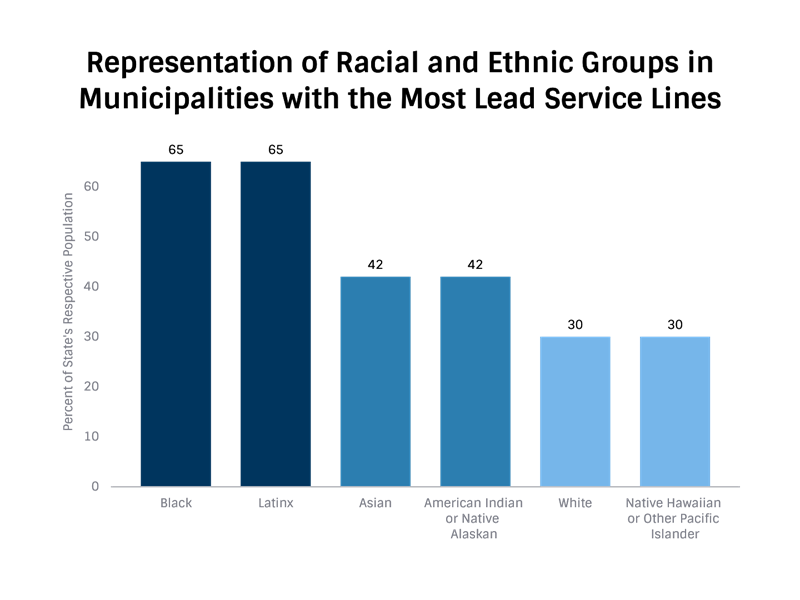
Chart 1: Representation of Racial and Ethnic Groups in Municipalities with the Most Lead Service Lines
As you can see from Chart 1 above, in these 50 municipalities, only 30 percent of the state’s White population resides. In contrast, these municipalities are home to 65 percent of the state’s Black population, 65 percent of the state’s Latinx population, and 42 percent of both the Asian American and Native American populations.
This data ultimately tells us that people of color in Illinois are substantially more likely – up to twice as likely – to live in municipalities where nearly all of Illinois’ lead service lines exist. Nearly 2 in 3 Black and Latinx Illinoisans live in these communities. Less than 1 in 3 White Illinoisans live there.
We can think about this another way: what's the demographic makeup within these 50 municipalities, and how does that compare to the demographics of the entire state?
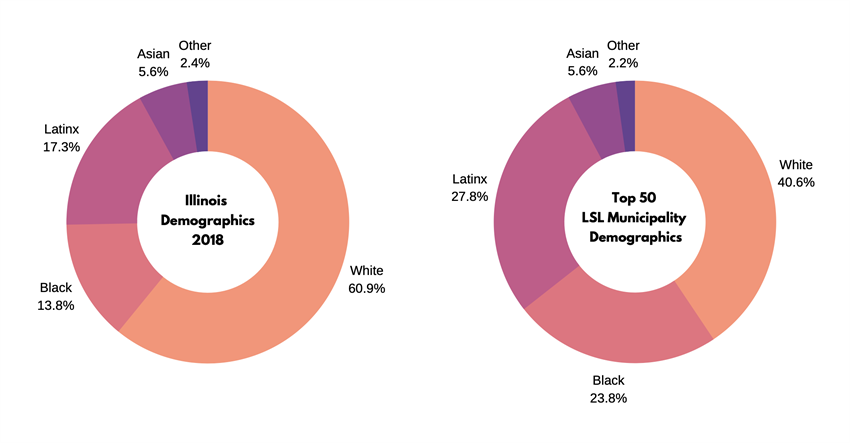
Chart 2 and 3: Illinois Demographics; Demographics of Municipalities in Illinois with the Most Known Lead Service Lines
As you can see in Charts 2 and 3 above, there is a higher proportion of Black and Latinx residents in municipalities with high numbers of lead service lines. Black residents make up 14 percent of Illinois’ total population; in these 50 municipalities, however, 24 percent of the population is Black. Meanwhile, Latinx residents comprise 17 percent of Illinois’ population, but 28 percent of the population in municipalities with the most lead service lines. At the same time, White residents make up 41 percent of the population of these communities, which is 20 percent below their share of Illinois’ population.
Put simply: Black and Latinx people are over-represented in these communities with the most lead service lines; White people are under-represented.
Municipality Profiles
To put this data into real-world context, let’s take a look at some of the municipalities with high numbers of lead service lines.
Let’s take this in a couple steps. First, there are communities where Latinx residents are over-represented, like the City of Aurora. In 2018, Aurora reported the second-highest number of lead service lines in Illinois—almost 20,000 lines. When looking at the demographics of the city, we see that Latinx residents are over-represented compared to Illinois’ population: Latinx residents make up 43 percent of the population in Aurora, while making up about 17 percent of the state population. This combination of high numbers of lead service lines and a high population of Latinx residents is thus one example of how the lead service line problem greatly affects people of color in Illinois. You can see a similar trend in Joliet:
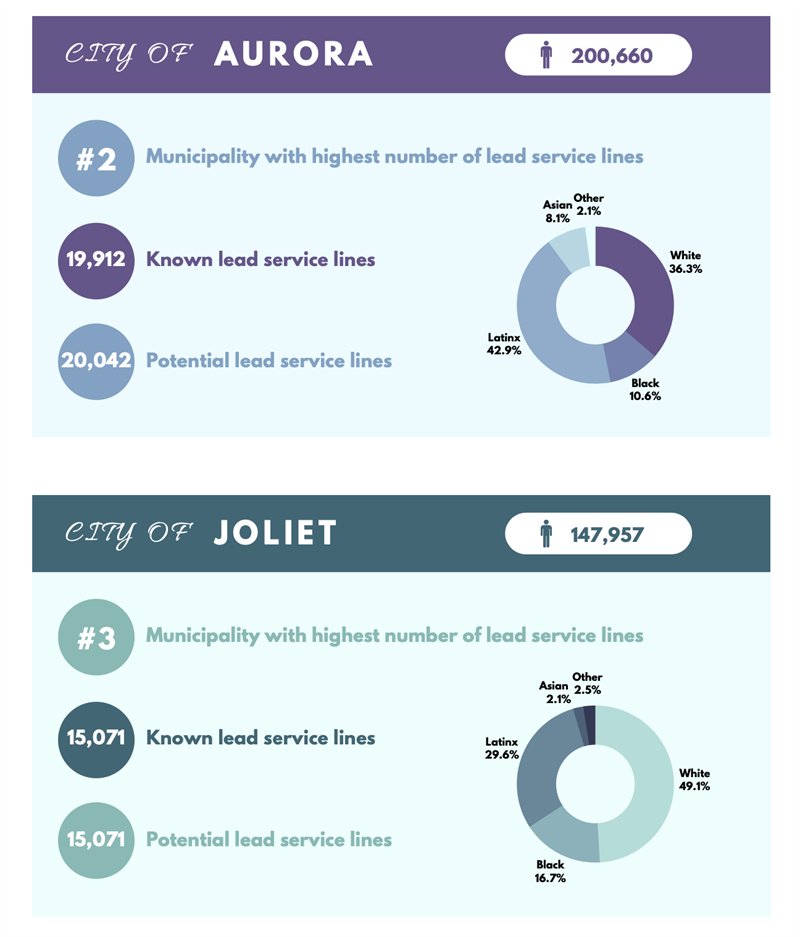
Chart 4 and 5: City of Aurora Demographics; City of Joliet Demographics
The story in Rockford offers an example where Black residents are over-represented in a community with a lot of lead service lines. In this community, Black residents make up 22 percent of the population, despite only constituting 14 percent of the state’s population. You can see this trend even more clearly in Dolton, where there are over 6,000 lead service lines and Black residents make up 91% of the population.
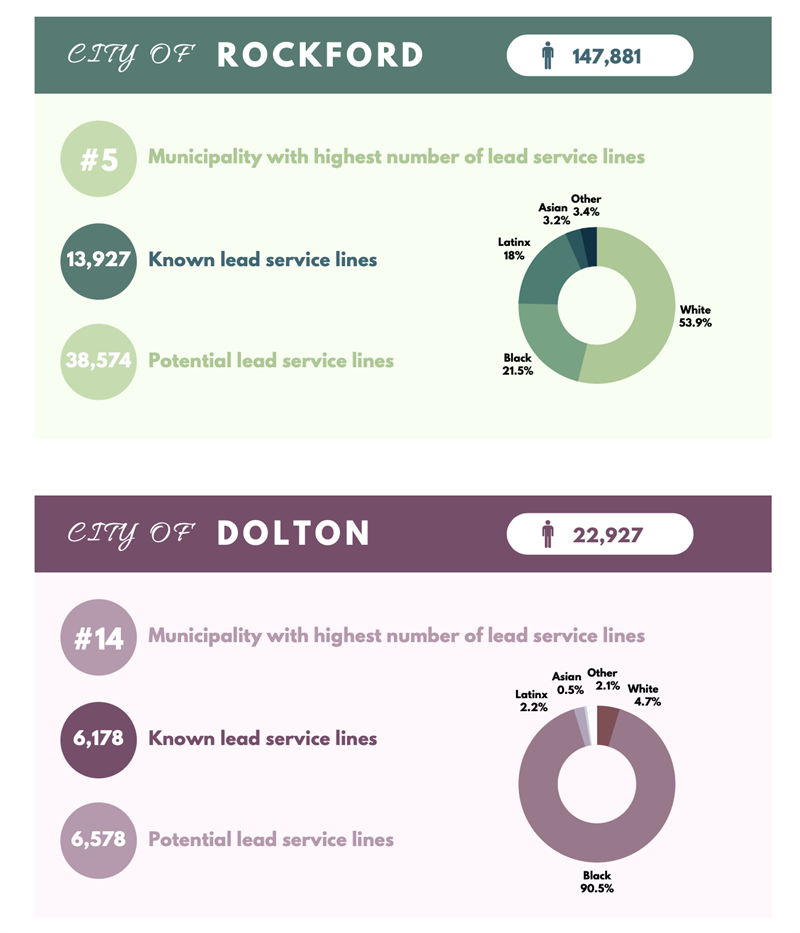
Chart 6 and 7: City of Rockford Demographics; City of Dolton Demographics
These snapshots illustrate the broader point: Communities with the most known lead service lines tend to contain higher percentages of Black and Latinx residents than the state population would suggest. And while we know the problem of lead service lines affects communities all across the state, residents of color are more likely to be living in communities where lead service lines are most present: a larger share of residents of color live in these communities, and they also make up a bigger percentage of individual municipalities' demographics.
Imperfect data yields imperfect results
A note about methods and data: we conducted the above analyses by looking at the Illinois Environmental Protection Agency’s (IEPA) Lead Service Line Inventory. In 2017, the Illinois General Assembly enacted a law requiring utilities throughout the state to report the composition of their service lines—copper, plastic, ductile iron, lead, etc.—to the IEPA. We then examined the distribution of lead service lines across the state, comparing that information to demographic data projected by the American Community Survey (of the U.S. Census Bureau) to see how race and ethnicity might correlate with exposure to lead service lines.
The data has its limitations. First, becuse the data is reported by utilities, there may not be consistency in reporting. To give you an illustration of the scale of the problem: 27.8% of all service lines are reported to be of an “unknown” material.
Second, we don’t know the demographics of individual households that have lead service lines. So while we know, for example, that Chicago has reported nearly 400,000 lead service lines, it’s not clear whether those are serving Black or Latinx residents at a higher rate than White residents. To definitively explore racial bias in the siting of lead service lines, we would need data on the exact locations of those lines. Unfortunately, the existing inventory data can only tell us the total number of lead service lines in each municipality.
The bottom line is that we need better data to fully understand the scale of any racially disproportionate burden in lead service line siting. For now, we can say that Illinois’ Black and Latinx residents are over-represented among the most lead-heavy communities. And a standard statistical test also suggests this relationship: there is a slight positive correlation between the number of lead service lines and percent of the population that is Black, Latinx, or Asian within a municipality; we found the opposite trend for percent of the population that is White. These opposing trends suggest what we outline above: that municipalities with a higher percent of Black, Latinx, or Asian residents have more lead service lines.
We need to recognize who will be most affected by Illinois’ inaction on its lead service line problem
Although it’s not perfect, this analysis suggests that Illinois' Black and Brown residents bear a disproportionate share of the lead service line problem. This analysis is consistent with national reports on the lead burden facing communities of color, such as a recent analysis from Healthy Babies Bright Futures, showing that Black children are disproportionately affected by lead in our drinking water.
One important implication of this analysis is that it directs us to center the needs of Black and Latinx residents and communities in any solution to our statewide lead service line problem. MPC and our partners are pushing for a statewide bill to require all utilities to replace their lead service lines. Essential to that work? Fighting for a dedicated funding source to help communities replace their lead service lines. This funding could work a lot like Minnesota’s Safe Drinking Water Fee, which is a small fee collected by Minnesota to provide assistance to water utilities. In the case of lead service lines in Illinois, that fee would be used to finance lead serve line replacement and related activities.
Without funding for lead service line replacement, some communities will never be able to tackle this problem.
A dedicated funding source for full lead service line replacement would enable every community, regardless of the income level of residents or the revenues flowing into a water utility, to finance full lead service line replacement. Without funding for lead service line replacement, some communities will never be able to tackle this problem. A dedicated state funding source is a fundamental building block of equitable community access to lead service line replacement.
If Illinois abdicates on our statewide responsibility to fund the replacement of lead service lines, we are essentially saying that it’s okay for our state’s Black and Brown residents to bear a disproportionate share of the cost to deal with this infrastructure problem.
In the absence of a state revenue source, it will fall to individual communities and homeowners to remove lead from their drinking water. And in this scenario, Illinois’ Black and Brown residents will disproportionately foot the bill, because they are twice as likely to be living in affected municipalities and make up a greater share of the population within them. If Illinois abdicates on our statewide responsibility to fund the replacement of lead service lines, we are essentially saying that it’s okay for our state’s Black and Brown residents to bear a disproportionate share of the cost to deal with this infrastructure problem.
If, as the data suggests, Black and Brown communities are disproportionately burdened by lead service lines, then a dedicated public funding source is an ethical imperative. A statewide funding source and a feasible, equitable replacement plan to accompany it would go a long way to reduce the burden of lead on communities of color and ensure all residents, regardless of their race or ethnicity, access to safe, clean drinking water.