
Ilmicrofono Oggiono on Flickr
‘Can I get a doctor in here?!’
It’s a cliché refrain often heard on TV dramas, and the assumption is that a medical professional will quickly barrel through the door. But MPC analysis shows, the availability of a doctor has everything to do with where you live.
A recent MPC examination of 2010 data from Chicago’s Health Atlas reveals a disproportionate lack of primary care physicians practicing in segregated low-income neighborhoods on the south and west sides of the city.
In a recent blog post we wrote about the relationship between Chicago’s historic segregation and patterns of health equity along these lines. Access to care is a social determinant of health, and one that is often determined by racial and economic segregation. This is why MPC is studying the effects of unequal access to care as part of the Cost of Segregation project.Of the 19 community areas designated as ‘racially concentrated areas of poverty’ in a recent Chicago Urban League Study, around half have only 1 primary care provider serving every 5,000 residents. That translates to .2, or less than half a doctor for every 1,000 residents, even though the average in Chicago is 1.0. A further look reveals that most of these areas are poor, majority-black neighborhoods like Greater Grand Crossing and Washington Park. In contrast, there is often 1 doctor per 250 residents in racially concentrated areas of wealth. These are generally wealthy, majority-white neighborhoods including Lincoln Square and Near North Side.
It’s important to keep in mind, especially in Chicago, that a doctor shortage doesn’t always have to be geographic. Geographic health shortages, like the ones described above, occur when everyone in the area has a lack of access to care. A shortage can also be population-group specific, for example a “low-income shortage.” This can be due to a lack of providers that will take uninsured patients, or those with certain types of insurance. These maps show geographic and low-income health provider shortage areas in Illinois.
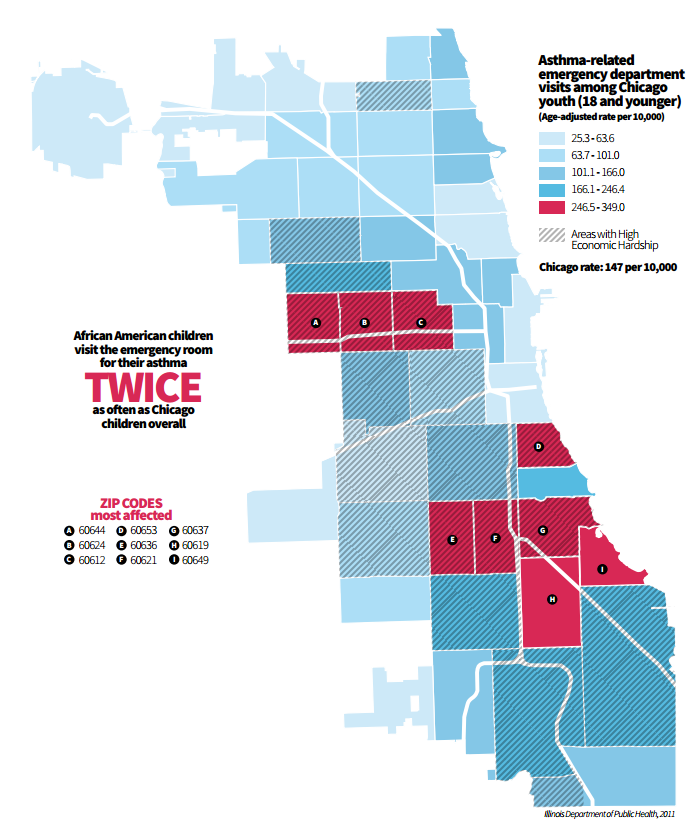
The negative impacts of these provider shortages may seem far-removed for those of us who don’t personally experience them, but these inequities have tangible impacts for many Chicagoans. Asthma is a great example of how access to primary care results in different outcomes by zip code, income, and ethnic group. According to asthma experts in Chicago, differences in asthma hospitalization and death by income level, ethnic group and geography are not due to a difference in rates of asthma.
The following map shows the differences in preventable asthma-related ER visits in Chicago, by zip code. Preventable means that these hospitalizations would not have occurred if the patient’s condition had “been managed successfully by primary care providers.” People with primary care are less likely to end up in the ER. A recent study found that uninsured patients go to the ER for 39% of their asthma-related care visits, compared to only 14% for insured patients. In short, insured patients are receiving primary care more often. Having consistent primary care results in better health outcomes overall.
Healthy Chicago 2.0; Chicago Department of Public Health
Asthma-related ER visits by zip code. Chicago, IL (2011)
So, access to care is a major social factor in the case of asthma. And yet some in our region still may not recognize how health inequity impacts them specifically. The Cost of Segregation study is about understanding what these inequalities cost our entire region. When inequalities in access to care lead to ER visits and hospitalizations, that costs us all; a recent study showed that the average asthma-related ER visit costs $1,502. According to Healthy Chicago 2.0, there are about 41,356 asthma-related ER visits in Chicago per year. This is a whopping $62 million price tag—$62,116,712 to be exact. And that’s just asthma…
The health inequities stemming from economic and racial segregation can shave years off of lives, making it easy to see why there is a staggering difference in life expectancy for Chicagoans depending on where you live. Between predominantly white and predominantly black neighborhoods, this gap can approach up to 33 years. Clearly, segregation goes far beyond your annual checkup.