
Katy on Flickr
It’s the part of the day most people dread. Drowsy from the morning or exhausted after a long day at work, millions of people across the region load into their cars, buses or trains and participate in the daily commuting grind.
Some days—when you are lucky—traffic is light, while other times, delays tack on minutes if not hours. And while lengthy and burdensome commutes are terrible for everyone, if you are African-American or Latino in Chicago, chances are they are even worse.
MPC analysis of Census data reveals that Chicago’s black and brown communities are disproportionately affected by long average commute times. While 35 minutes is the average across all census tracts (see map below), commutes are as high as 56 minutes within the Chicago commuting zone (CZ): the seven county region including Cook, DuPage, Kane, Kendall, Lake, McHenry, and Will counties.
All of the top 20 census tracts with the highest commute times in the region (49-56 minutes) are located in Chicago-proper, and at least 80% of the population is represented by non-white residents, which in this case means either African-American or Latino. Furthermore, 19 out of 20 of these tracts are at least 88% African-American, and over half have a median household income below $30,000.
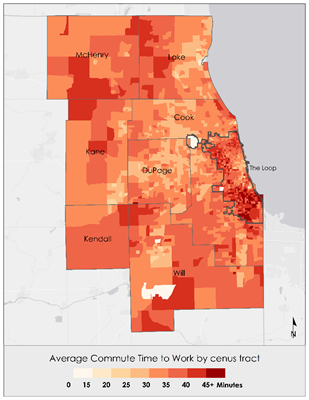
US Census Bureau 2011-2015, ACS 5-Year Estimates
Average Commute Time by Census Tract, Chicago Commuting Zone
Similar patterns play out in the larger community areas in which these tracts are located. Of the 12 community areas represented, all but two have an African-American population of 82% or higher. A quick scan of the list unearths the same names that we highlighted in our Doctor Deficits blog post: communities on the city’s south and west sides, such as Greater Grand Crossing or West Englewood, that are highly racially segregated and have struggled for decades with concentrated poverty.
Last year, the Chicago Metropolitan Agency for Planning (CMAP) published their Travel Trends snapshot report, which presents data on the amount of time spent traveling to work by race. CMAP found that on average, the region’s black workers spent an additional 5 minutes commuting each way per day; in a week that adds up to almost an hour of additional commute time over other races.
Though this hour may seem expendable for many of us, ease of mobility can be a determining factor in quality of life. Indeed, notable work by Raj Chetty and other researchers at the National Bureau of Economic Research reveals that long commute times play a significant role in predicting residents’ upward mobility across US commuting zones—the reason being that long commutes make it more difficult to reach or maintain employment opportunities and other resources. In an additional blog post, we delve into the implications of this mismatch for the region.
Of the census tracts with the shortest average commute times in the City of Chicago (22-27 minutes), 17 of 20 are represented by a 50-86% white majority. The median household income of these tracts ranges from $21,000 to over $160,000, with households in all but five tracts earning a median income over $60,000 annually. This stands in stark contrast to the top 20 longest commute tracts, where most households were earning at least $30,000 less annually.
While not necessarily the picture of perfect integration, these shortest-commute tracts are generally more racially diverse than their ‘long commute’ counterparts, with notably heavier Asian populations. At the community-area level, we see a geographical dispersion far different from long-commute tracts; with the exception of four tracts in Hyde Park, and one tract in Norwood Park, the majority of tracts with the shortest average commute are located in the city’s north-central and northwest communities—areas like the Loop, and Near North Side.
The following maps display the location of the longest and shortest commute tracts, in addition to the overall degree of white and black racial concentration for all Chicago census tracts. With these maps we can glean some idea of the relationship between racial segregation and commute time in Chicago. While 19 of the longest commute tracts are solidly placed within a distinctly concentrated African-American cluster (with the exception of Belmont Cragin in the northwestern part of the city, which is predominantly Latino), the same cannot be said of the 20 shortest tracts, which are surrounded by both mid-to-heavy white and black-populated areas.
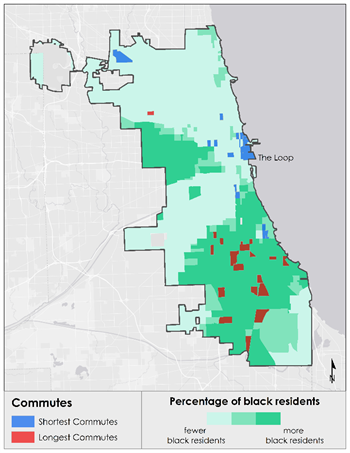
US Census Bureau 2011-2015, ACS 5-Year Estimates
Degree of black racial concentration, City of Chicago
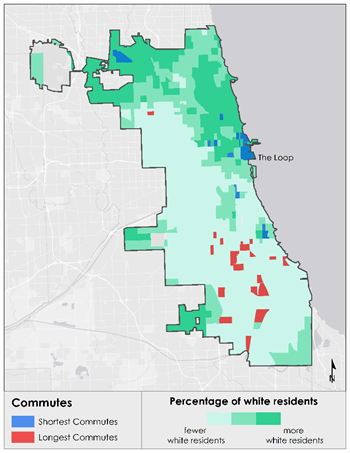
US Census Bureau 2011-2015, ACS 5-Year Estimates
Degree of white racial concentration, City of Chicago
The Chicago region’s transportation network is a vital and daily part of life for many, serving 35 suburbs, six counties, and the city of Chicago with annual ridership reaching 516 million in 2015. Although this represents a slight increase (0.4 percent) over 2014 ridership numbers, our transit system leaves many residents out of the loop. Given its place as the second largest public transportation system in the US, it is imperative that planners and policymakers pay attention to the ways in which we measure quality of life with respect to transit. This goes beyond safety and accessibility and touches upon the question of commute time.
The fact that certain riders are spending disproportionately large parts of their day on their commute is a problem in and of itself, while the fact that this occurrence is inextricably tied to geography, race, and income merits our immediate time and attention.
Recognizing the role segregation plays in this problem, MPC is currently working to quantify the costs to the region of all of us living so separately from one another through the Cost of Segregation study. In Phase II of this study, we will work with local experts and advisors to generate and model policies that ensure a more equitable future for our region.