Chicago is losing African-Americans at an unprecedented rate, due in part to lack of opportunity in the Windy City. But even as America’s Sun Belt cities attract people of color, these new residents may once again be shut out of the economic engines of their communities.

Flickr user Kelly Reed
Houston's skyline, taken in August of 2012
The Sun Belt tends to attract movers with promises of lower costs of living and better job opportunities. Houston and Phoenix in particular hail from a cohort of Sun Belt regions that have experienced remarkable growth in population from the 1990s onwards. As recently noted by the Brookings Institution, both regions typify a broader trend in which urban population growth is increasingly driven by residents of color.
But do promises of a better life in these areas translate equitably, inclusive of growing numbers of black and Latino/a residents? Short answer: not entirely.
MPC analysis of the 20 year period from 1990 to 2010 reveals that residents of color in both areas may not be able to access the same resources (or access them at the same rate) as white residents. In Houston, its decreasing white population rather than its burgeoning population of color has been responsible for large increases in wealth across its neighborhoods. In Phoenix, access to high-earning, economically productive jobs were more widely available to white residents, a segment of its population that is both shrinking and aging. Neither case represents a sustainable pathway for equitable growth.
Troubled by Chicago’s population loss and motivated by a vision for a more equitable future, MPC is keen on understanding whether migration patterns underscore how communities of color have been empowered to make a space for themselves within the economic engines of their regions.
Some Sun Belt regions do a better job than Chicago at attracting people of color
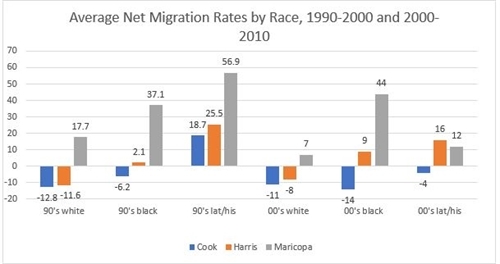
Between 1990 and 2010, we found that Houston’s Harris County and Phoenix’s Maricopa County attracted Black and Latino/a residents at much higher rates than Chicago’s Cook County managed to [see figure below, Average Net Migration Rates by Race, 1990-2000 and 2000-2010]
Metropolitan Planning Council
Data compiled from University of Wisconsin-Madison’s Applied Population Laborator
In both decades, for example, Cook County displayed negative net migration rates for black residents. During the same period, net migration of black residents in Harris and Maricopa counties was so positive, that the gap in migration rates between Cook and Harris, and Cook and Maricopa in the 2000’s was 23 and 58 percentage points,respectively.
And though Cook County experienced a positive and robust in-migration of Latino/a residents in the 1990’s, the rate was substantially lower than that seen in Harris or Maricopa County during the same decade: 25.5, and 56.9 percent. During the 2000’s, Cook County actually observed negative net migration of Latino/a residents, while both Harris and Maricopa counties observed positive net migration rates of over ten percent.
Houston’s gains in median household income were concentrated in white communities
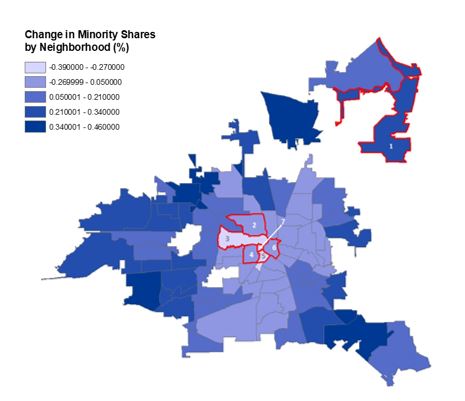
Our analysis of decennial Census data for the city of Houston reveals that though its Latino/a population more than doubled over the 20 years we examined, Latino/a residents underperformed across multiple measures of economic productivity. In the 7 neighborhoods that observed a significant increase in median household income (outlined in red, defined as a more than 50 percent rise between 1990 and 2010), only one—Lake Houston—experienced an increase in its non-white population. [see map below, depicting the change in non-white population shares by neighborhood in Houston].
Metropolitan Planning Council
Data compiled from mySidewalk Time Series Data Viewer
This finding harkens back to our earlier analysis, which revealed that in Chicago, of the 20 neighborhoods during this same time period that experienced an increase in median household income over 50 percent, none were majority-black.
To get a feel for how changes in wealth were distributed across Houston as a whole, we split the city’s neighborhoods into three groups based on whether their median household income saw a positive, slightly positive/negative, or negative percent change between 1990 and 2010. We then compared the average racial breakdown in each neighborhood to the expected breakdown (i.e. if residents of all 3 major racial/ethnic groupings were equally distributed), and found that white residents were overrepresented in neighborhoods where median household income (MHI) increased dramatically, and underrepresented in neighborhoods that experienced a significant decrease in median household income. Houston’s Latino/a residents were underrepresented in neighborhoods that experienced any gain in MHI over the 20 years [see table below, depicting changes in MHI by average Houston neighborhood racial breakdown].
|
Changes in MHI by Houston Neighborhood Racial Breakdown
|
white
|
black
|
Latino/a
|
|
Increase (+8.5% to +241%)
|
31.16%
|
27.40%
|
34.73%
|
|
Slight Inc/Dec (-5.2% to +7.6%)
|
38.46%
|
24.22%
|
34.04%
|
|
Decrease (-30.2% to -5.3%)
|
17.34%
|
29.76%
|
46.35%
|
|
Average Houston neighborhood
|
23.27%
|
26.37%
|
44.01%
|
Phoenix’s share of Latino/a workers with white collar jobs remained stagnant over 20 years
In Phoenix, we found that the city’s lack of access to wealth-building opportunities for residents of color was best captured by an analysis of labor statistics. Even though the city’s relative share of Latino/a workers increased fastest between 2000 and 2010, (nearly three times as fast as its share of white workers), their relative share in higher earning, management and professional type occupations remained largely the same (12.6 percent in 2000 compared to 14.1 percent in 2010). Compared to white residents, about twice the number of Latino/a workers were employed in service occupations in both 2000 and 2010.
Across most race/ethnicity groups that we studied, workers remained entrenched in their previous occupational fields over time. But we did observe a notable exception for Phoenix’s black population, which experienced a slight shift in favor of management and professional occupations through the decade (27.1 percent in 2000 compared to 31.7 percent in 2010).
Looking across each city’s ‘home county’, it became clear that the patterns of occupational entrenchment by race noted in Phoenix’s Maricopa County were present in Chicago’s Cook County and Houston’s Harris County as well. Over the 20 years, all three regions recorded stagnant shares of non-white workers employed in high earning occupations, while large shares of each county’s white population continued to dominate in white-collar fields.
So what can these regional examinations teach us?
Though many factors could contribute to the lack of income gains and occupational stagnation noted above, it’s important to note that both Houston and Phoenix are among the most sprawling regions in the U.S—a reality that, at least for Houston, some blame on its lack of a formal zoning code. Given the inherent challenges in much smaller regions of maintaining affordable mass transit systems, attracting employers across a diversity of industries, and providing accessible social services beyond city limits, it might not seem all that surprising that Houston and Phoenix’s residents of color are shut out of equitable growth trends.
In our own (much smaller) region, extensive black population loss suggests that there’s still something in the ‘equity equation’ we’ve yet to figure out. Even areas of Chicagoland that are gaining in black and Latino/a residents (or at the least, not losing them in large quantities) are not necessarily growing in ways that benefit those populations; take growing suburban poverty, as an example. We must turn, then, to economic growth strategies that deliberately benefit people of color, both as a way to further economic gains for all, but also as a method of population retention. For this to happen, it will take a regional commitment to inclusive growth to reshape the way we view and measure prosperity in Chicagoland. While we persist with committed partners and stakeholders towards this and other goals, MPC will continue to examine the drivers and beneficiaries of economic productivity in the racially and economically diverse cities of the future.
---------------------------------------------------------------------------------------------------------------------------------------------------------Findings from MPC’s Cost of Segregation study suggested that the Chicago region stands to gain if we can lower our historically high levels of racial and economic segregation to those of other regions at the median. Through study trips, dialogues, and data analyses, our team has come to recognize an important truth: segregation is a part of the story, but it’s only a start. Any vision for our region’s future must center on equity, which is why MPC was so proud this past May to release Our Equitable Future--a "roadmap" of two dozen policy recommendations that help chart a course for needed policy change in Chicagoland. Check back on the blog for updates on how this work is unfolding!
Annie Yang is a former MPC Research Assistant.