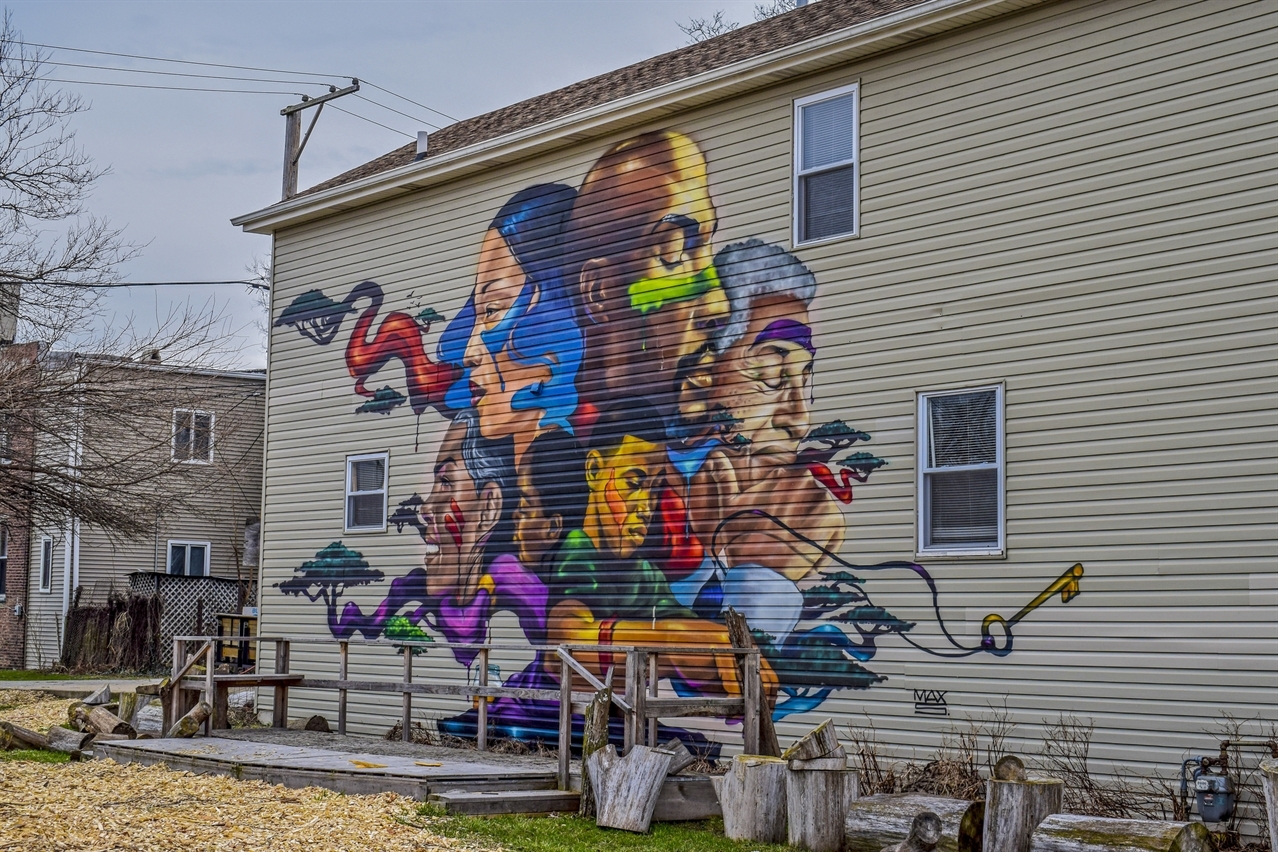
Art by Max Sansing. Image by Flickr user MBA Photography
Community art at Sweet Water Foundation's Think-Do House in Englewood, part of the Perry Ave Commons
Tweet this
This past autumn, JPMorgan Chase announced a $40 million investment towards Chicago’s south and west side neighborhoods, designed to “jump-start job training, small-business growth and neighborhood rebirth.” Chase models its investments after a similar initiative in Detroit, which the organization described not as “a mission of charity but as a carefully planned investment.” By embodying the same approach—that is, acknowledging that many south and west side communities are still worthy of investment, despite their challenges—there is the potential for tremendous success in Chicago, as well.
Given that strategic investments require a clear-eyed understanding of the realities on the ground, MPC was curious to know what’s been going on in these south and west side neighborhoods over the past decade, and what the current landscape looks like.
With a wealth of data at our fingertips, MPC’s Research Team analyzed 4 variables—population growth, median household income, poverty rate and median home value—using Census data across two time periods: 2006 to 2010, and 2011 to 2015. Each of these variables was tracked and analyzed for the 50 Chicago community areas that encompass the city’s following districts: West Side, South Side, Southwest Side, Far Southeast Side and the Far Southwest Side. It should be noted that, while we gathered data on all Chicago community areas for the purposes of certain comparisons, we have excluded findings for community areas in the Central, North Side, Far North Side, and Northwest Side areas.
By measuring how these 50 community areas performed during the latter period compared to the prior (adjusting dollar values for inflation to 2015 numbers), we determined which ones had shown progress, stagnated or fallen behind. These findings give investors, community development practitioners and neighborhood residents alike a clearer understanding of the realities in our city, thereby informing responsible investment decisions in the future.
In Douglas, home value appreciation outpaces the rest of the south and west sides
To start, we found that, even compared to more highly invested areas of the city, certain communities on the south and west sides have made noteworthy strides on crucial quality-of-life indicators. At the top of the list?
Douglas: a community area comprised of the Bronzeville, Prairie Shores, and Groveland Park neighborhoods. When evaluated across our four variables, Douglas’ change in median home values—an increase of nearly 51 percent, from $188,567 (in 2015 dollars) to $284,075—stands out in particular.
Douglas’ percentage growth in home values was highest out of all city community areas, meaning its home value growth outpaced the rates of much wealthier places like Lincoln Park and Lakeview.
This change across the two periods is notable for two reasons: First, while most areas on the south and west sides experienced depreciation on the order of at least 25 percent, Douglas saw appreciation, and on a sizable level.
Secondly, Douglas’ percentage growth in home values was highest out of all city community areas, meaning its home value growth outpaced the rates of much wealthier places like Lincoln Park and Lakeview. The fact that the Douglas community area managed a 50 percent increase when all others in the city experienced absolute declines is an observation worthy of attention, especially when considering how the city as a whole was rebounding from the struggles of the recession.
Consider the map below, depicting the change between our two 5-year periods of analysis (2006-2010 vs. 2011-2015). All of the city’s community areas are displayed, color-coded by the percentage degree to which their homes, on average, depreciated or appreciated. (Note that no data is available for Fuller Park, hence its lack of color.)
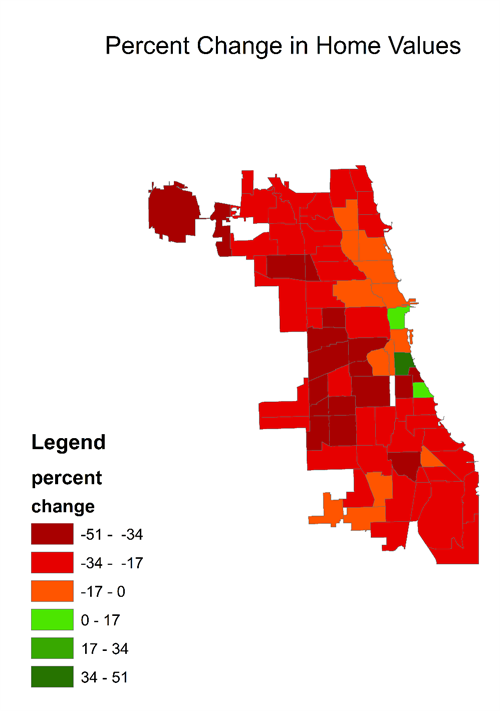
Average percentage change in Chicago median home values by community area, 2006-2010 and 2011-2015
As the map depicts, Douglas exhibited extreme home appreciation, while the majority of the city, and indeed most south and west side neighborhoods, experienced significant depreciation—anywhere between -17 percent and -51 percent.
That being said, it’s important to keep in mind that narratives depend on how you “slice” the data and choose your baseline; for one, a 51 percent increase in value means little if Douglas’ starting home values were some of the city’s lowest to begin with. That distinction, however, goes to Riverdale, which, for our baseline period, had median home values of $105,873 in 2015 inflation-adjusted dollars.
Douglas’ median home values rose to the 6th highest among the 50 south and west side community areas we examined, from 35th just ten years earlier. Even while 5 other south and west side community areas ended up with higher overall home values, this progression in the rankings is truly noteworthy.
We also considered that our findings might change depending on how we chose to measure appreciation: by a percent change or an absolute dollar value change. In both cases, however, Douglas experienced the biggest positive change out of all city community areas. When we averaged the dollar value change across the entire city, we found that home values over the period fell by over $71,000 on average. Douglas, on the other hand, experienced an incredible gain of over $95,000.
In a city of falling population, Washington Park offers a brighter narrative
At a time when the story of Chicago’s population loss “is becoming exclusively a story about black population loss,” population gains in majority-black communities should be celebrated.
Take Washington Park, for instance, where the most recently available data shows that 96 percent of the community is made up of black residents.
Though Washington Park’s home values have suffered over the decade, the community has experienced a nearly 22-percent growth in population, an eye-popping ten-fold increase, compared to the average 2.19 percent growth for all Chicago community areas. Compared to south and west side community areas exclusively, the finding is even more noteworthy, as growth among this group was on the order of less than 1 percent. In fact, the only other community area that experienced a higher percentage increase in the bunch was Oakland.
In absolute numbers, Washington Park experienced an increase from 7,134 to 8,694 residents. This jump may seem inconsequential, but its population change represents the 14th highest gain (in terms of number of residents) in the entire city. Also of note are the population increases in South Lawndale, which experienced the 5th highest gain, and Douglas, which experienced the 10th highest gain.
Oakland reduces poverty and increases income
Progress in Oakland has been multi-pronged, even larger in scope than a simple population increase. When comparing community area gains in median household income (MHI) and reduction in the poverty rate, Oakland lands at the front of the pack.
While most areas that we examined exhibited declines in MHI of more than 10 percent (Roseland, Auburn Gresham, East Garfield Park), Oakland’s MHI rose by more than 8 percent, from $19,960 (in 2015 inflation-adjusted dollars) to $21,635. Increases in MHI in south and west side neighborhoods were few and far-between, and Oakland’s gains (followed closely by Hyde Park’s and Avalon Park’s) far surpassed the decline of 7 percent on average for all community areas in the city.
Similarly, after analyzing changes in poverty rates, we found that most neighborhoods fared worse off at the end of the observation period than they had at the beginning, with the exception of Oakland and a few others. Averaging across all of the city’s community areas, we observed a 13.4 percent increase in the poverty rate; Oakland, on the other hand, experienced a decrease of 11 percent.
The above findings, while promising, convey the reality that gains across the city’s south and west sides have been far from uniform. Many neighborhoods still struggle with climbing poverty and high rates of crime, though the hopeful narratives that we’ve illuminated above should not be ignored.
In conclusion
MPC applauds Chase for investing in historically under-resourced parts of our region. Smart analysis informs wise investments, and that’s why MPC crunches the numbers in our Data Points columns, in the media and in our forthcoming State of the Region report: an equity-focused study that will illuminate data trends and findings regarding the performance of the 7-county Chicagoland region as it currently stands, and through time. Check back frequently for project updates and “sneak peeks” of our findings!